Download
1 / 58
590 likes | 602 Views
Measuring Trauma Outcomes Injury Severity Score (ISS) Probability of Survival (Ps17) Hospital Survival rate ( Ws ) BOAST4 Chest Wall Injury report The Trauma Audit & Research Network (TARN). Injury Coding. Injury coding performed centrally at TARN Ensuring coding uniformity

E N D
Measuring Trauma OutcomesInjury Severity Score (ISS)Probability of Survival (Ps17)Hospital Survival rate (Ws)BOAST4Chest Wall Injury reportThe Trauma Audit & ResearchNetwork (TARN)
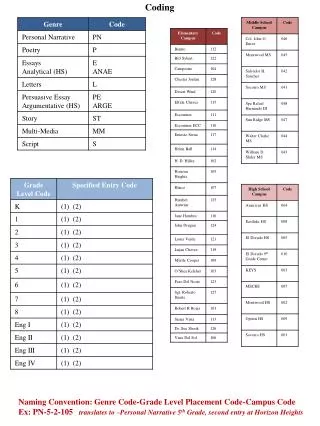
Injury Coding • Injury coding performed centrally at TARN • Ensuring coding uniformity • Coders check injury descriptions & imaging reports • Abbreviated Injury Scale dictionary (AIS2005) currently used • Every submission assigned an Injury Severity Score (ISS) • 75,000 submissions per year coded
Abbreviated Injury Scale: AIS • THE Internationally recognised system for injury scoring • Produced by AAAM (Association for the Advancement of Automotive Medicine)in U.S.A • Introduced in 1970, originally for Vehicle Crash investigators • AIS2005 version >2000 injury descriptors • Anatomically based system, ranking injuries according to severity on a 6 point ordinal scale
AIS Severity indicates The relative risk of “threat to life” in an average person who sustains the coded injury as his or her only injury It’s not a disability scale
AIS: Spinal Injuries • Cervical Spine (C1-C7) • Thoracic Spine (T1-T12) • Lumbar spine (L1-L5) Severity can be affected by location of spinal injury
AIS: Confirmed injuries only Suspected injuries Possible injuries Probable injuries Ruled out injuries
AIS: Not Coded • Infections • Pneumonia • Death • Blindness • Miscarriage • Epilepsy following head injury • Pulmonary embolism following skeletal injury • Don’t affect Severity score
NFS: Not Further Specified This appears throughout the AIS dictionary & allows the coding of injuries when detailed information is lacking Example: Injury description = Liver laceration Coded as: 541820.2 (Liver laceration NFS)
AIS 6: Maximum score AIS 6 not used just because a patient dies! • Has to be documented medical evidence of an AIS 6 injury
AIS 6: Maximum score • Head or Neck • Brain stem: laceration, crush, penetrating or transection • C3 or higher complete cord transection or contusion • Sigmoid or Transverse sinus or Internal carotid artery: Bilateral lacerations • Thorax • Heart: rupture, multiple lacerations or avulsion • Total chest crush • Aortic rupture + haemorrhage not confined to mediastinum • Bilateral pulmonary artery or vein transection • Severe inhalation • Abdominal & Pelvic contents • Liver avulsion • External • 2nd or 3rd degree burns > 90% Total Body Surface • Massive Whole body Explosion type injury
AIS: Localisers • 2 additional localiser codes, allow coding of: • Localiser 1 Side or aspect of an injury • e.g. Right, left, Upper, Temporal, Frontal • Localiser 2 Actual Site of an injury • e.g. 5th rib, 12th Thoracic vertebrae, 2nd toe • Don’t affect ISS • Used mainly in Research
AIS dictionary • Available only from: www.aaam.org • Latest Version: AIS 2015 recently released • $225 each + shipping • TARN will moving to AIS2015 at end of year • All existing codes will be mapped over • All Trusts notified well in advance
853251.3 752372.3 856164.5 450203.3 140626.5 150400.2 544224.3
Calculating the ISS Injury Severity Score
Calculating the ISS: Step 1 Determine the scores of the individual injuries using the Abbreviated Injury Scale
Calculating the ISS: Step 2 • Identify the highest severity score in each body area
Injury Severity Score: 6 body areas • Head & Neck & Cervical spine • Face • Chest & Thoracic spine • Abdomen & pelvic contents & Lumbar spine • Extremities & bony pelvis • External (incl. Skin injuries and Burns)
Calculating the ISS: Step 3 • Square the highest score in each body area
5² =25 3² =9 3² =9 5² = 25
Calculating the ISS: Step 4 • Code individual injuries • Identify the highest score in each body area • Square the highest score in each body area • Add together the highest AIS2 from 3 different body areas
5² =25 3² =9 3² =9 5² = 25
Injury Severity Score • (ISS) = 59
Injury Severity Score (ISS) 2² = 4 2² = 4 ISS = 8
Injury Severity Score (ISS) 2² = 4 2² = 4 1² = 1 ISS = 9
Injury Severity Score (ISS) • Ranges from 1 to 75 • Maximum 75 achieved in 2 ways: • Severity 5 in 3 different body areas • 52 + 52 + 52 = 75 • ISS convention: • AIS = 6 in any body area, ISS = 75
Importance of Injury Detail • Length, depth or Grade of lacerations (especially to internal organs) • Depth, size and location of haemorrhages and contusions (especially in the brain) • Open or Closed fractures • Stability & site of Fractures (e.g. Comminuted/Displaced Shaft/Proximal/Distal fracture) • Articular (joint) involvement (e.g. Intra-articular, extra-articular) • Blood loss • Vessel damage • Location & number of rib fractures • Compression or effacement of ventricles/brain stem cisterns • Neurology associated with spinal cord injuries • Grade, Instability, Blood loss or Vascular damage associated with Pelvic Fractures • Cardiac arrest associated with asphyxia or drowning • Ensure all injuries are documented • Include imaging reports or Post Mortems for every submission. • Jan 17: Grade now requested for pelvic ring fixations
Probability of Survival Once ISS is assigned Probability of Survival (Ps) calculated eachsubmission
Why calculate PS? • Need to assign weight to deaths and survivors. • Some deaths more statistically significant than others. • Case mix adjustment. • Performances measurement: hospital and networks.
Ps history • TARN developed first Ps model in 2004 • Remodelled in 2007, 2009, 2012, 2014 and 2017 • Components used in Ps since 2014 (best predictors of outcome): • ISS • Age • Gender • GCS • Pre-Existing Medical Conditions (PMC) • Charlsoncomorbidity index adds ‘weighting’ PMC
Ps17 (launched July 17) * *Charlson index (1984, revised).
What is Ps? PS% is retrospective measure of pts with same profile on TARN database. TARN database: past 4 years (Approx 300,000 cases) Ps = 63%, then 63 out of every 100 patients with that profile have previously survived. 37 out of every 100 patients have previously died.
Probability of Survival Ps is calculated using: GCS taken on arrival in ED at first receiving hospital where unavailable Pre Hospital GCS where unavailable Presence of Intubation/ventilation where unavailable Impute a “probable” GCS (equivalent weighting)
Ps17 Weighting groups Pre-Existing Medical Conditions
Ps17 Weightings for Age, GCS, Gender & PMC
Ps17 Weightings for Age, GCS, Gender & PMC
Ps17 Weightings for Age, GCS, Gender & PMC
Ps17 Weightings for Age, GCS, Gender & PMC
Ps17 Weightings for Age, GCS, Gender & PMC
Ps17 Weightings for Age, GCS, Gender & PMC
Ps17 Importance of accurate injury detail
Ps17 Importance of accurate injury detail
PS breakdown: shown on website & clinical reports (more later) • Ps Bandings • No. of patients in each band • Observed/Actual survivors • Expected survivors (compared to TARN database) • Difference = Observed – Expected x 100 • No. in group • Ws = Difference x fraction of patients on database in each band Hospital Survival Rate= 0.67 additional survivors per 100 patients 95% Confidence interval Ws lies between this line
Individual Hospital Survival Rateshown on website: English & Welsh sites only +1.2 Survivors Statistically significant outcome (+0.39 to +1.97) +1.2 Survivors Not Statistically significant (-1.83 to +4.2)
Comparative Survival rate (Ws) shown in Clinical report: All hospitals Your hospital 95% confidence intervals
Funnel plots: Potential outlier (positive) Normal range All hospitals Greater Precision: More cases (more reliable) Lower Precision: Fewer cases (not as reliable) Hospitals shown by Precision (no. of cases) Ws must always be viewed in conjunction with Case ascertainment