Download
1 / 31
310 likes | 386 Views
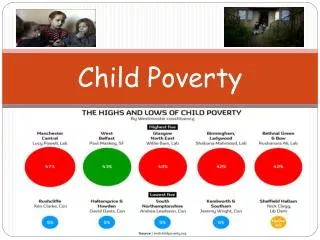
Growing up in the panel Towards longitudinal measurement of child poverty. Katharine Hall Children’s Institute, University of Cape Town 3 rd Conference of the International Society of Child Indicators York July 2011. South Africa Provinces: 9 Population: 49 million

E N D
Growing up in the panelTowards longitudinal measurement of child poverty Katharine Hall Children’s Institute, University of Cape Town 3rd Conference of the International Society of Child Indicators York July 2011
South Africa • Provinces: 9 • Population: 49 million • Child population: 19 million (38%) • High unemployment (2010 official: 25% | expanded: 36%) • High income poverty • Poverty levels have declined only slightly since democracy, despite massive roll-out of social grants • High (and growing) income inequality (Gini: 0.7 in 2008) • Pronounced and persistent racial inequality • Spatial poverty traps – previous Bantustans remain pockets of poverty: little infrastructure, few employment opportunities, and home to disproportionate numbers of children and pensioners. • BUT also an increase in urban poverty – partly due to migration.
Child-centred poverty measures • 1. The child population is distributed differently to the adult population • Internal labour migration, uncertain job prospects, urban housing backlogs, the availability of extended family for child care, dual household arrangements and urban-rural oscillation – all contribute to unequal spatial distributions (i.e. combination of choice & constraint) • Households with children are larger than adult-only households: • Aggregated household-level and population figures mask the situation of children – who are, by many measures, ‘worse off’ than adults.
Child-centred poverty measures • 2. ‘Adult’ indicators, such as unemployment, have important consequences for child poverty. But reports seldom, if ever, use children as unit of analysis. • Unemployment is directly linked to poverty. Using the lower bound… • 55% of children are “poor” when there is at least one working adult; • 90% of children are “poor” when there are no working adults.
Child-centred poverty measures • 3. Sometimes, ‘standard’ or official indicators are not child-appropriate • Eg. minimum norms and standards for “adequate water” = potable water within a 200m radius of the dwelling. • Similarly for sanitation (where minimum service level is ventilated pit latrine). • But qualitative research suggests that off-site communal services are inappropriate, even dangerous, for children.
Child-centred poverty measures • 4. Child-specific indicators • Education • Mortality, health and nutrition • Social grants targeted to children • Household context and care – co-residence & care arrangements, orphaning
Child-centred indicators: • Demography (incl. orphaning and care arrangements) • Income, unemployment & social grants • Housing and services • Nutrition • HIV & Health • Education • 40 indicators in 6 domains
Limitations of cross-sectional data • Repeated household surveys can be treated longitudinally to show a general trend, but do not allow us to ask… • Who is progressing out of poverty and who is not? • What are the factors that drive these dynamics • – why does poverty persist? • – what are the pathways out of poverty? (“bucking the trend”) • What is the long-term impact of social benefits and interventions?
A new national panel study: NIDS • NATIONAL INCOME DYNAMICS STUDY • Inclusion of data on children – unusual for income-focused survey • Broad definition of the household (unlike official surveys) • Relationships of care, information about caregivers • Longitudinal v. cross-sectional – follows panel members • National focus v. discrete site • Rather than presenting a static picture, it is possible to link individuals across rounds so that children’s progress can be followed as they grow older and move into adulthood. • Possibilities for examining income mobility, geographic mobility, care arrangements and outcomes over space and time.
The NIDS child panel • Full panel: 7,300 households (all members become part of the panel in Wave 1 – total of 28,000 individuals • 11 500 children aged 0-17, evenly distributed (± 640 in each year) • - Nationally representative in Wave 1 • Panel rounds at 2-year intervals • All household members are followed, even if they change household or move province • Children born to female sample members become part of the panel • Extent of attrition not yet known • Future of panel not yet sure (at least three rounds)
What to focus on? The Multiple Deprivations Model. Centre for the Analysis of South African Social Policy www.casasp.ox.ac.uk
Child poverty & the effect of social grants Data source: NIDS Wave 1 (H & Ö = Hoogeven & Özler) From: Hall & Wright (2010) A profile of children living in South Africa in 2008.
Co-residence and care arrangements • Only 34% of children live with both their parents • A quarter of children do not live with their biological mother. • The majority of these mothers live somewhere else. • NIDS records information about absent household members, and also (in the child questionnaire) specifically about absent (and deceased) parents). It also records information about household members who are de facto caregivers Source: NIDS 2008
Co-residence & outcomes for children Data source: NIDS Wave 1
Spatial mobility among children • Location is key to dimensions of poverty, linked to child outcomes. • Apartheid spatial arrangements persist – many children in under-resourced areas. • Changing patterns in adult migration likely to affect children • Increasing female migration + signs of permanent migration • Children do not necessarily move together with adults. • Independent female migration linked to motherhood, and to the presence of maternal substitutes in ‘sending’ household • Urban in-migrant children worse off than urban-born children (BT20) • Policy implications – need to anticipate increased urban child population (through in-migration and urban births).
Spatial mobility among children 21% of children have moved since birth (3.7 million) Proportion of mobile children increases with age Source: NIDS Wave 1
Living environments & child outcomes • Many children live in “traditional” dwellings - in turn associated with poor services. • Children are particularly vulnerable to the effects of poor services: • 11% of child deaths (under 5) are attributed to diarrhoea; • every year, children are burnt in shack fires. • Children are disproportionately represented in overcrowded dwellings, particularly informal urban settlements; they are vulnerable to the risks associated with overcrowding – including rapid spread of infectious disease, and abuse. • Difficult to measure these health outcomes directly
Child outcomes: what is feasible? • HEALTH • Birth details: birth-weight, head circumference (unavailable for many) • Anthropometric data - can calculate: • stunting (height for age – chronic malnutrition affects cognitive development) • underweight (weight for age, under 10 only) • wasting (weight for height) / obesity (BMI) • EDUCATION • School access – pre-school participation; school attendance (days absent from school in a month), distance to school • School achievement / progress – grade repetition, age-for-grade; • Numeracy tests (not useful?)
Main thematic focus of analysis Child poverty is structural – racial, spatial; part of the political economy. Access to services and resources, opportunities and even family structure is pre-determined. income and expenditure dynamics living environments spatial mobility household composition & care NIDS is designed to provide good information in these areas.
www.childrencount.ci.org.za kath.hall@uct.ac.za This work was undertaken with the financial assistance of the PSPPD, a partnership programme between The Presidency, Republic of South Africa, and the European Union (EU).