Download
1 / 81
810 likes | 948 Views
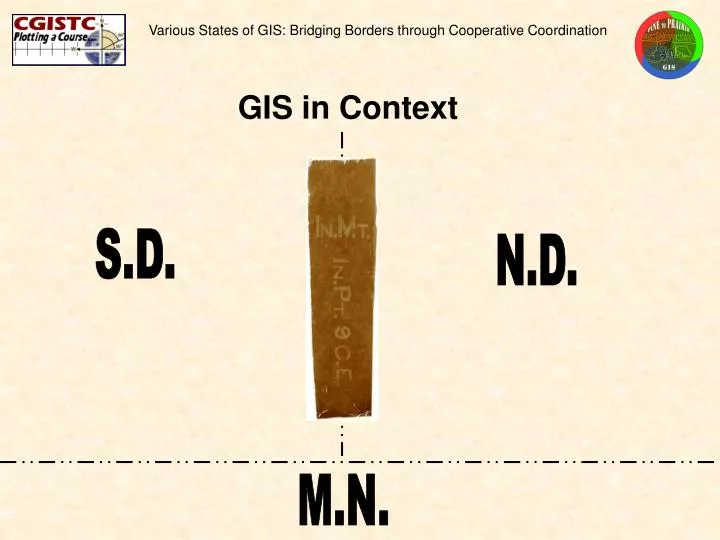
Various States of GIS: Bridging Borders through Cooperative Coordination . GIS in Context. S.D. N.D. M.N. Various States of GIS: Bridging Borders through Cooperative Coordination . GIS in Context. Administratively – North Dakota – Minnesota – South Dakota

E N D
Various States of GIS: Bridging Borders through Cooperative Coordination GIS in Context S.D. N.D. M.N.
Various States of GIS: Bridging Borders through Cooperative Coordination GIS in Context Administratively – North Dakota – Minnesota – South Dakota Geographically – Southern Reaches of the Red River Basin; ND, MN, SD
Various States of GIS: Bridging Borders through Cooperative Coordination • The Bridge of • Communicating GIS to Users • Communicating GIS in all contexts • The Bridge of Coordination • Coordinating users at all levels • Coordinating GIS related efforts in all contexts • The Bridge of Cooperation • Cooperating with users at all levels • Cooperating in GIS efforts in all context…when appropriate. • The Bridge of Planning • Planning for opportunities to build bridges in the future...for other users to cross
Various States of GIS: Bridging Borders through Cooperative Coordination The Bridge of Communication Let me introduce to you…
Various States of GIS: Bridging Borders through Cooperative Coordination Pine to PrairieGIS User Group An Overview Presented to the North Dakota GIS Users Conference October 24, 2006
Various States of GIS: Bridging Borders through Cooperative Coordination The Bridge of Coordination Let me introduce to you…
Various States of GIS: Bridging Borders through Cooperative Coordination Coordinating a Community Approach to GIS in the Southern Red River Basin
Various States of GIS: Bridging Borders through Cooperative Coordination Wilkin County City Of Breckenridge Red River Basin Commission Minnesota Governor’s Council on Geographic Information
Various States of GIS: Bridging Borders through Cooperative Coordination • Vision – CGISTC Our vision as the Community GIS Technical Committee includes establishing a progressively planned, highly standardized, and forward moving GIS to initially serve the citizens throughout the communities of Wahpeton, Breckenridge, Richland and Wilkin Counties, and beyond. It includes a long-term commitment to establish a seamless GIS which acts as an easily accessible resource for all community members and outside entities such as other local, state, and federal governments and their agencies, for the purpose of enhanced decision making, reduction in data duplication, and increased information management efficiency.
Various States of GIS: Bridging Borders through Cooperative Coordination GOALS of a community GIS • Interfaced, Interoperable and/or Integrated • Effective Reduction of Duplicity • Efficient Information Management • Adhering to Acceptable Standards
Various States of GIS: Bridging Borders through Cooperative Coordination FED Gvmt. ND GIS CW CB RC MN GIS WC WSW IWI GENERAL PUBLIC
Various States of GIS: Bridging Borders through Cooperative Coordination FED Gvmt. Established Standards ND GIS CW OGC FGDC ANSI ISO CB RC MN GIS WC WSW IWI GENERAL PUBLIC
Various States of GIS: Bridging Borders through Cooperative Coordination WAN LAN VPN FTP ODBC FED Gvmt. Established Standards ND GIS CW OGC FGDC ANSI ISO CB RC MN GIS WC CGISTC Shared Server WSW IWI Web Services GENERAL PUBLIC
Various States of GIS: Bridging Borders through Cooperative Coordination WAN LAN VPN FTP ODBC FED Gvmt. GOS 2 National Map Established Standards ND GIS CW OGC FGDC ANSI ISO CB Web Services RC MN GIS WC CGISTC Shared Server WSW IWI Web Services Web Services GENERAL PUBLIC
Various States of GIS: Bridging Borders through Cooperative Coordination So, What Are We Doing…Practically Speaking? • Serving the needs of our organizations in the context of a larger geographic extent and coordinating efforts by way of business process to do so. • Auditors Office • Highway Departments • Emergency Managers • Assessors Office • Water Resource Boards • School Superintendents • Health and Social Services
Various States of GIS: Bridging Borders through Cooperative Coordination The Bridge of Cooperation Parcels, Soils & Taxation – Richland Wilkin Counties Water, Water Everywhere – NOAA Grant for AFWS Imlementation The OpenMNND (Open Mind) Project(www)
Rural Parcel Creation Process • Adjust PLSS Section Corners/Lines • Rebuild PLSS Section Polygons • Rebuild PLSS Quarter-Quarter Polygons • Generate aliquot parcels from short legal description
Adjust PLSS Corners • Original PLSS layers from ND Data Hub • Corners adjusted using aerial imagery • 1m DOQ primary reference image • Additional aerial imagery used as supplemental reference • Street Intersections assumed PLSS corner locations • Good starting point • Provides ‘cleanest’ parcel output.
PLSS Corner Adjustment Average Adjustment: 13 meters Range of Adjustment: 0-80 meters
Aliquot Parcel Builder Results Fractional section parcels >=5 Acres are generated from the short legal description in county tax data.
Aliquot Parcel Builder Results 5800 Parcels 83% of Total County Acreage
Urban/Plat Parcels Rectify Scanned Plat Drawings to Aerial Imagery
Update Process • As the PLSS layer(s) are updated for accuracy, parcels can be regenerated in the impacted areas. • Updated tax data can be used to reprocess parcels and perform updates.
Conclusion • This process is meant to provide a quick and cost effective means of establishing a base parcel dataset. • Roads, other visible feature digitizing could occur at the same time of PLSS adjustment. (Currently very poor accuracy)
Various States of GIS: Bridging Borders through Cooperative Coordination The Bridge of Cooperation Parcels, Soils & Taxation – Richland Wilkin Counties Water, Water Everywhere – NOAA Grant for AFWS Imlementation The OpenMNND (Open Mind) Project(www)
Various States of GIS: Bridging Borders through Cooperative Coordination Southern Basin GAP Project(Gauge Acquisition and Placement)NOAA sponsored Automated Flood Warning System grant to place seasonal stream stage and precipitation gauge data collectors throughout the southern 1/3 of the Red River Basin.
Various States of GIS: Bridging Borders through Cooperative Coordination What’s it all about • Automated Flood Warning System. • Filling gauge coverage gaps in the lower 1/3 of the Red River Basin. • Enhance existing flood models & hydrologic prediction. • Proactive mitigation & preparedness planning. • Enhancing GIS utilization in the region.
Various States of GIS: Bridging Borders through Cooperative Coordination Automated Flood Warning System. Satellite & Communications Telemetry Equipped Stream & Precipitation Gauge Data Collectors USGS Satellite System USGS Data Processing Advanced Hydrologic Prediction Service (AHPS) Local GIS (City, County, & State) ESRI ArcINFO multi-site license & Spatial Analyst extension. Local authorities convene after being contacted by AFWS. EOC established if necessary. Local level warnings—bridge & road closure, etc.,—pushed to Reverse 911 notification system and MapServer or IMS site for informing general public as necessary. NOAA forecasting centers receive data with NESDIS ID for use in HADS.
Various States of GIS: Bridging Borders through Cooperative Coordination Filling gauge coverage gaps.
Various States of GIS: Bridging Borders through Cooperative Coordination Filling gauge coverage gaps.
Various States of GIS: Bridging Borders through Cooperative Coordination Enhance existing flood models & hydrologic prediction. • MIKE 11 • HEC-RAS • SWAT • HAZUS
Various States of GIS: Bridging Borders through Cooperative Coordination MIKE 11 • DHI's MIKE 11 software package is a versatile and modular engineering tool for modeling conditions in rivers, lakes/reservoirs, irrigation canals and other inland water systems. It is designed for: • flood risk analysis and mapping • design of flood alleviation systems • real-time flood forecasting • real-time water quality forecasting and pollutant tracking • hydraulic analysis/design of structures including bridges • drainage and irrigation studies • optimization of river and reservoir operations • dam break analysis • water quality issues • integrated groundwater and surface water analysis
Various States of GIS: Bridging Borders through Cooperative Coordination HEC-RAS • HEC-RAS is an integrated system of software, designed for interactive use in a multi-tasking, multi-user network environment. The system is comprised of a graphical user interface (GUI), separate hydraulic analysis components, data storage and management capabilities, graphics and reporting facilities. • The HEC-RAS system will ultimately contain three one-dimensional hydraulic analysis components for: (1) steady flow water surface profile computations; (2) unsteady flow simulation; and (3) movable boundary sediment transport computations.
Various States of GIS: Bridging Borders through Cooperative Coordination SWAT • Model Objective • Predict the effect of management decisions on water, sediment, nutrient and pesticide yields with reasonable accuracy on large, ungaged river basins. • Model Components • Weather, surface runoff, return flow, percolation, ET, transmission losses, pond and reservoir storage, crop growth and irrigation, groundwater flow, reach routing, nutrient and pesticide loading, water transfer.
Various States of GIS: Bridging Borders through Cooperative Coordination SWAT • Model Operation • Daily time step-long term simulations • Basins subdivided to account for differences in soils, land use, crops, topography, weather, etc. • Basins of several thousand square miles can be studied • Soil profile can be divided into ten layers • Basin subdivided into subbasins or grid cells • Reach routing command language to route and add flows • Hundreds of cells/subbasins can be simulated in spatially displayed outputs • Groundwater flow model • SWAT accepts output from EPIC • SWAT accepts measured data and point sources • Water can be transferred from channels and reservoirs • Nutrients and pesticide input/output • Windows Interface • GRASS GIS links to automate inputs
Various States of GIS: Bridging Borders through Cooperative Coordination HAZUS • HAZUS Loss Estimation Flood Model • The flood loss estimation methodology consists of two modules that carry out basic analytical processes: flood hazard analysis and flood loss estimation analysis. The flood hazard analysis module uses characteristics, such as frequency, discharge, and ground elevation to estimate flood depth, flood elevation, and flow velocity. The flood loss estimation module calculates physical damage and economic loss from the results of the hazard analysis. The results are displayed in a series of reports and maps. • Users may perform three levels of analysis using the HAZUS-MH Flood Model. As noted below, the required input data and expertise vary according to the level of analysis:
Various States of GIS: Bridging Borders through Cooperative Coordination HAZUS • LEVEL 1All of the information needed to produce a basic estimate of local flood losses are included as default data, based on national databases and nationally applicable methods. • LEVEL 2More detailed input data will be needed, including detailed information on local conditions. Modification of default databases will be required, along with the inclusion of local data and analyses. • LEVEL 3Detailed and site-specific input data are used to create state-of-the-art damage estimates and situation assessment profiles. Level 3 is intended for the expert user. • The Flood Information Tool (FIT), released in 2002, is designed to process locally available flood information and convert it into data that can be used by the HAZUS-MH Flood Model. The FIT is a system of instructions, tutorials, and GIS analysis scripts. When provided with user-supplied inputs (e.g., ground elevations, flood elevations, and floodplain boundary information), the FIT calculates flood depth and elevation for riverine and coastal flood hazards. The FIT is intended to help users perform Level 2 or Level 3 flood hazard analyses. The user is allowed to input various combinations of data (i.e., default data provided with the model and community-specific data provided by the user) in order to customize the analysis.
Various States of GIS: Bridging Borders through Cooperative Coordination Proactive mitigation & preparedness planning. “The Red River Basin economy is influenced directly and indirectly by water, not only in terms of water supply for processing plants, drinking water, etc., but also through the impacts of flooding (e.g., delayed spring planting, disruption to businesses, etc.). Basin-wide flood damages (including both Canada and the U.S.) after the flood of 1997 were estimated at $5 billion USD/$6.85 billion CDN (IJC 2000), or $5.8 billion USD in 2004 dollars” (Red River Basin Natural Resources Framework Plan p.3; Red River Basin Commission; May, 2005).
Various States of GIS: Bridging Borders through Cooperative Coordination Proactive mitigation & preparedness planning. Furthermore, “Estimated evacuations of the ’97 flood include 80,000 people in North Dakota, Minnesota, and Manitoba, including 47,500 of the 50,000 residents of Grand Forks, with five flood-related deaths in the two states and Canada, including a mother and daughter who died in their truck when a road washed out near Wahpeton.” (Associated Press 1997).
Various States of GIS: Bridging Borders through Cooperative Coordination Proactive mitigation & preparedness planning. “Total losses for the Red River Region comprise roughly 72.25 % of all claims paid in North Dakota by FEMA during a period from 1974 through Sept. 2004 (Devils Lake region accounts for an additional 23 % of losses paid during the same period, leaving only 5 % for covered loss throughout the rest of the entire state of North Dakota); current policies in force as of Sept. 2004: 5,152 (FEMA Loss and Policy Statistics by State).
Various States of GIS: Bridging Borders through Cooperative Coordination Proactive mitigation & preparedness planning. Flood mitigation remains a top priority for communities throughout the region. “The 1997 flood in the Red River basin generated a strong determination by all levels of government to identify quickly, evaluate, and implement permanent flood reduction projects for existing urban communities along the Red River of the North. The communities include the city of Wahpeton and its sister city, Breckenridge where there is strong public and interagency recognition of the need for a permanent flood reduction project.” (USACE, 2005).
Various States of GIS: Bridging Borders through Cooperative Coordination Enhancing GIS utilization in the region • ArcInfo Package • Spatial Analyst Extension • 3D Analyst Extension
Various States of GIS: Bridging Borders through Cooperative Coordination ArcInfo Package ESRI www.esri.com • ArcInfo is the most complete and extensible GIS available. It includes all the functionality of ArcView and ArcEditor and adds advanced geoprocessing and data conversion capabilities. Professional GIS users use ArcInfo for all aspects of data building, modeling, analysis, and map display for screen and output. • A complete GIS out of the box, ArcInfo provides all the functionality for creating and managing an intelligent GIS. This functionality is accessible via an easy-to-use interface that is customizable and extensible through models, scripting, and applications.
Various States of GIS: Bridging Borders through Cooperative Coordination Spatial Analyst ESRI www.esri.com • ArcGIS Spatial Analyst provides powerful tools for comprehensive, raster-based spatial modeling and analysis. Using ArcGIS Spatial Analyst, you can derive new information from your existing data, analyze spatial relationships, build spatial models, and perform complex raster operations. • Example applications of ArcGIS Spatial Analyst include • Contractors who use ArcGIS Spatial Analyst to identify areas suitable for new development. • Hydrologists who use hydrologic modeling to analyze temporal changes in sedimentary processes in a given terrain.
Various States of GIS: Bridging Borders through Cooperative Coordination 3D Analyst ESRI www.esri.com • ArcGIS 3D Analyst allows you to effectively visualize and analyze surface data. Using ArcGIS 3D Analyst, you can view a surface from multiple viewpoints, query a surface, determine what is visible from a chosen location on a surface, create a realistic perspective image that drapes raster and vector data over a surface, and record or perform three-dimensional navigation. • The ArcGlobe application in ArcGIS 3D Analyst allows you to manage and visualize, from a local or global perspective, extremely large sets of three-dimensional geographic data. ArcGlobe provides the capability to seamlessly interact with any geographic information as data layers on a three-dimensional globe.
Various States of GIS: Bridging Borders through Cooperative Coordination The CGISTC Community GIS Technical Committee Our vision as the Community GIS Technical Committee includes establishing a progressively planned, highly standardized, and forward moving GIS to initially serve the citizens throughout the communities of Wahpeton, Breckenridge, Richland and Wilkin Counties, and beyond. It includes a long-term commitment to establish a seamless GIS which acts as an easily accessible resource for all community members and outside entities such as other local, state, and federal governments and their agencies, for the purpose of enhanced decision making, reduction in data duplication, and increased information management efficiency.
Various States of GIS: Bridging Borders through Cooperative Coordination Partners