Download
1 / 38
390 likes | 550 Views
Plug-and-play visualization with the Science of Science Tool. Ted Polley , Chin Hua Kong, and Dr. Katy Börner.

E N D
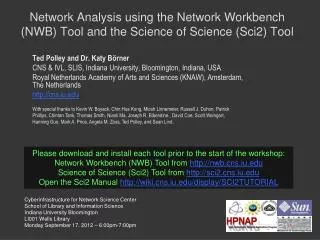
Plug-and-play visualization with the Science of Science Tool Ted Polley, Chin Hua Kong, and Dr. Katy Börner With special thanks to Kevin W. Boyack, Chin Hua Kong, Micah Linnemeier, Russell J. Duhon, Patrick Phillips, Chintan Tank, Thomas Smith, Nianli Ma, Joseph R. Biberstine , David Coe, Scott Weingart, HanningGuo, Mark A. Price, Angela M. Zoss, Ted Polley, and Sean Lind. Cyberinfrastructure for Network Science Center School of Library and Information Science Indiana University Bloomington Statewide IT Conference Indiana Memorial Union, Walnut Room September 25, 2012 – 9:30am-10:00am
Presentation Overview • Macroscopes/CIShell • Introduction to Sci2 • Sci2 v0.5.2 Alpha • Sci2 v1.0 Alpha • Types and Levels of Analysis Capable with Sci2 • File Formats Supported by Sci2 • Sci2 User Interface • Sci2 Supported Tools • Gnuplot • GUESS • Cytoscape • R • Gephi • Coming soon… VOSviewer • Sci2 Visualizations • General • Temporal • Geospatial • Networks • Topical • Q&A • Adjourn 2
Macroscopes Decision making in science, industry, and politics, as well as in daily life, requires that we make sense of datasets representing the structure and dynamics of complex systems Macroscopes provide a vision of the whole, helping us synthesize the related elements and enabling us to detect patterns, trends, and outliers while granting access to myriad details Rather than making things larger or smaller, macroscopes let us observe what is too great, slow, or complex for the human eye and mind to notice and comprehend Microscopes Telescopes Macroscopes 3
Plug-and-Play Macroscopes While microscopes and telescopes are physical instruments, macroscopes are continuously changing bundles of software plugins Macroscopes make it easy to • Select and combine not only domain-specific algorithms and bridges to existing tools but also to meet the cross-cutting infrastructural requirements needed for a scientifically rigorous cyberinfrastructure • Put together plugins to create customized tools and share plugins via email, flash drives, or online • Simply drop plugins into the tool they appear in the menu, ready to use • Sharing algorithm components, tools, or novel interfaces becomes as easy as sharing images on Flickr or videos on YouTube 4
OSGi & Cyberinfrastructure Shell (CIShell) • CIShell (http://cishell.org) is an open source software specification for the integration and utilization of datasets, algorithms, and tools • It extends the Open Services Gateway Initiative (OSGi) (http://osgi.org), a standardized, modularized service platform • CIShell provides “sockets” into which algorithms, tools, and datasets can be plugged using a wizard-driven process Developers Users Alg Workflow Sci2 Tool CIShell Wizards CIShell Workflow Alg Alg Workflow NWB Tool Tool Workflow Tool 5
Science of Science (Sci2) Toolhttp://sci2.cns.iu.edu • Explicitly designed for SoS research and practice, well documented, easy to use. • Empowers many to run common studies while making it easy for exports to perform novel research. • Advanced algorithms, effective visualizations, and many (standard) workflows. • Supports micro-level documentation and replication of studies. • Is open source—anybody can review and extend the code, or use it for commercial purposes. 6
Sci2 Tool v0.5.2 Alpha (Dec 19, 2011) • New Features • Support new Web of Science format from ISI • Support network overlay for geographical map • Support Prefuse's visualizations on Macs OS • Improvements • Improve memory usage and processing time of Extract top N nodes and Extract top N Edges algorithms • Unify merging algorithms used by database • Bug fixes • Fix legend boundary issue in geographical map • Fix typo error on the output data label • Fix slice by year algorithm 7
Sci2 Tool v1.0 Alpha (June 13, 2012) • Major Release • featuring a Web services compatible CIShellv2.0 (http://cishell.org) • New Features • Google Scholar citation reader • New visualizations such as • geospatial maps • science maps • bi-modal network layout • R statistical tool bridging • Gephivisualization tool bridging • Comprehensive online documentation • Release Note Details • http://wiki.cns.iu.edu/display/SCI2TUTORIAL/4.4+Sci2+Release+Notes+v1.0+alpha 8 8
Sci2 Tool – Supported Data Formats • Input: • Network Formats • GraphML(*.xml or *.graphml) • XGMML (*.xml) • Pajek .NET (*.net) • NWB (*.nwb) • Scientometric Formats • ISI (*.isi) • Bibtex (*.bib) • Endnote Export Format (*.enw) • Scopus csv (*.scopus) • NSF csv (*.nsf) • Other Formats • PajekMatrix (*.mat) • TreeML (*.xml) • Edgelist (*.edge) • CSV (*.csv) Formats are documented at http://sci2.wiki.cns.iu.edu/display/SCI2TUTORIAL/2.3+Data+Formats. • Output: • Network File Formats • GraphML (*.xml or *.graphml) • Pajek .MAT (*.mat) • Pajek .NET (*.net) • NWB (*.nwb) • XGMML (*.xml) • CSV (*.csv) • Image Formats • JPEG (*.jpg) • PDF (*.pdf) • PostScript (*.ps) 11
Sci2 Tool – Supported Tools GUESS exploratory data analysis and visualization tool for graphs and networks. https://nwb.slis.indiana.edu/community/?n=VisualizeData.GUESS. Gnuplot portable command-line driven interactive data and function plotting utility http://www.gnuplot.info/. 13
Sci2 Too – Supported Tools Adding more layout algorithms and network visualization interactivity via Cytoscape http://www.cytoscape.org. Simply add org.textrend.visualization.cytoscape_0.0.3.jar into your /plugin directory. Restart Sci2 Tool Cytoscape now shows in the Visualization Menu Select a network in Data Manager, run Cytoscape and the tool will start with this network loaded. 14
Sci2 Tool – Bridged Tools R statistical tool bridging Gephivisualization tool bridging 15
Sci2 Tool Visualizations: General Use GnuPlot to visualize the degree distribution of a co-authorship network extracted from ISI data… 16
Sci2 Tool Visualizations: Temporal Use Temporal Bar Graph to visualize NSF funding profiles over time… 17
Sci2 Tool Visualizations: Geospatial Use the Proportional Symbol Map to size and color symbols proportionally to numeric data, in this case the 20 most populated cities around the world… 18
Sci2 Tool Visualizations: Geospatial Use the Choropleth Map to color regions proportionally to numeric data, in this case the US by state population… 19
Sci2 Tool Visualizations: Geospatial Overlay a geospatial network on a base map, in this case Albert-LászlóBarabási and his collaborators… 20
Sci2 Tool Visualizations: Networks Use GUESS to visualize networks, such as this co-authorship network extracted from ISI data… 21
Sci2 Tool Visualizations: Networks Use Circular Hierarchy to visualize networks with community attributes appended… 22
Sci2 Tool Visualizations: Networks Use the Bipartite Network visualization to create a network of authors and publication titles… 23
Sci2 Tool Visualizations: Topical Use the Map of Science via Journals visualization a network drawn the result of mapping a dataset's journals to the underlying subdiscipline(s) those journals contain… 24
Sci2 Tool Usage at National Science Foundation Topic co-occurrence network of the 2885 cognitive and neuroscience NSF projects funded between 2007 and 2011. Statistical text mining (Topic model) was used to identify topics from NSF awards and proposals from 2000-2011. Each award is tagged with up to 4 topics. Lines represent the co-occurrence of the connected topics within an award(s). The nodes are scaled by number of awards (max = 355) and the lines are scaled on number of co-occurrences (max =91). The node colors differentiate the nodes via the level-0 Blondel communities. This is … an entirely new way of characterizing and understanding the NSF portfolio. This is in part because this enables analysis of the content of the awards/proposals independent of the institutional structure. One can quickly identify ALL of the Cog/Neuro awards throughout the entire NSF portfolio – so it captures research in all of the unexpected institutional places. This method also allows one to easily identify areas of parallel or potentially collaborative research being funded by different institutional structures and … to identify potential areas for advancing science by facilitating collaborations. Leah G. Nichols, NSF 25
Sci2 Tool Usage at National Institutes of Health Mapping Transdisciplinary Tobacco Use Research Centers Publications: Compare R01 investigator based funding with TTURC Center awards in terms of number of publications and evolving co-author networks. Zoss& Börner, forthcoming. Supported by NIH/NCI Contract HHSN261200800812 27
Sci2 Tool Usage at National Institutes of Health Sci2 Tool now supports Web services and serves as a visual interface to publically available NIH RePORT Expenditure and Results RePORTER)/ RePORTERdata provided by NIH. 28
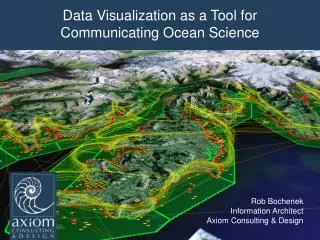
Sci2 Tool Usage at the National Oceanic and Atmospheric Administration (NOAA) Co-author network generated from publications supported by NOAA’s Office of Ocean Exploration and Research (OER). Nodes are sized based on the number of publications produced and colored to highlight clustering. Edges are sized and colored based on the number of collaborations between authors. • For details, see “Visualizing Networks of Scientific Research” • by Chris Belter • http://www.infotoday.com/online/may12/Belter-Visualizing-Networks-of-Scientific-Research.shtml 29
Sci2 Tool Usage at the National Oceanic and Atmospheric Administration (NOAA) Central section of a word co-occurrence network of words drawn from the titles of OER-supported journal articles. Some words have been truncated. Nodes are sized by the number of times the word is used and edges are sized and colored based on the number of publications in which they co-occur. Weaker edges have been removed for clarity. Nodes colored blue are those that have been used 10 or more times in the publication set. 30
Sci2 Tool Usage at US Department of Agriculture (USDA) First time portrait of intramural research conducted by the U.S. Department of Agriculture (USDA) presented at the VIVO Conference 2012. 31
Sci2 Tool Usage at James S. McDonnell Foundation How did cognitive neuroscience of attention emerge from neurobiology and psychology, 1980–2005? Author co-citation analysis and Pfnet is used to trace prospectively the development of the field from its precursor disciplines: cognitive psychology, single cell neurophysiology, neuropsychology, and evoked potential research. 34
Sci2 Tool Usage at James S. McDonnell Foundation By 1990 a distinct cognitive neuroscience specialty cluster emerges, dominated by authors engaged in brain imaging research. Bruer, John T. (2010). Can we talk? How the cognitive neuroscience of attention emerged from neurobiology and psychology, 1980.2005. Scientometrics, 83(3), 751-764. http://ivl.cns.iu.edu/km/tools/2010-bruer-scientometrics.pdf 35
Q & A Download a copy of Sci2 by visiting http://sci2.cns.iu.edu Read the documentation available at http://wiki.cns.iu.edu/display/SCI2TUTORIAL All papers, maps, tools, talks, press are linked from http://cns.iu.edu CNS Facebook: http://www.facebook.com/cnscenter Mapping Science Exhibit Facebook: http://www.facebook.com/mappingscience If you have questions feel free to email me dapolley[at]indiana[dot]edu 36
Related Talks Monday Tuesday 37
We are Hiring! Senior Software Engineer/Research Analyst (3IT) IU Job #6839 As Senior Software Engineer, you will perform research and programming for current and future externally funded research projects at the CNS Center. These projects include tools powered by the Cyberinfrastructure Shell (CIShell, http://cishell.org), an open-source software platform that supports the interchange of datasets and algorithms; MapIN, a map of Indiana’s expertise and resources; and other online interactive maps and web sites. You will participate in the entire software development process, from the collection of user stories through planning, implementation, testing, deployment, and documentation. You will also be expected to participate in the training new developers, and the creation of educational material for workshops. As Senior Software Engineer, you will have a chance to help set the standards of our team in many areas, including code, teamwork, product direction, and process. Software Developer (2IT) IU Job #6862 As a Software Developer, you will work in a team of four to perform research and programming for current and future externally funded research projects at the CNS Center. The main focus will be on tools powered by the Cyberinfrastructure Shell (CIShell, http://cishell.org). CIShell is an open-source software platform, built on Java and OSGi that allows developers and scientists to easily exchange datasets and algorithms, and bundle them into custom tools that serve the particular needs of research communities. You will participate in the entire software development process, from the collection of user stories through planning, implementation, testing, deployment, and documentation. 38