Download
1 / 24
340 likes | 997 Views
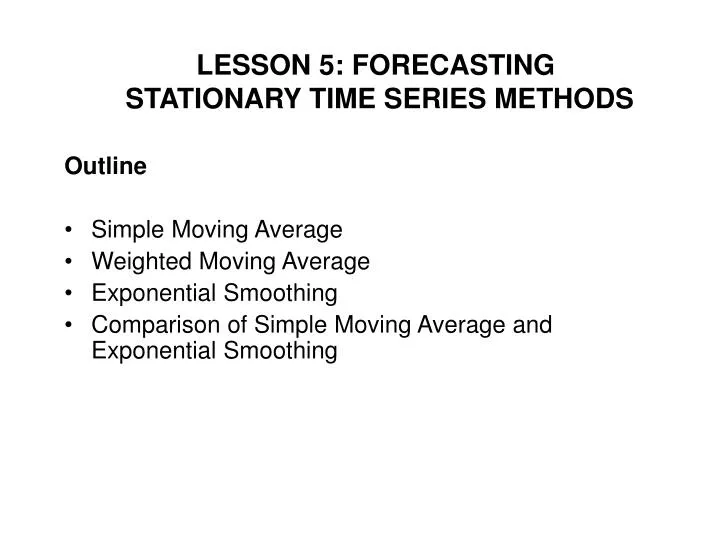
LESSON 5: FORECASTING STATIONARY TIME SERIES METHODS. Outline Simple Moving Average Weighted Moving Average Exponential Smoothing Comparison of Simple Moving Average and Exponential Smoothing. Time Series Methods.

E N D
LESSON 5: FORECASTING STATIONARY TIME SERIES METHODS Outline • Simple Moving Average • Weighted Moving Average • Exponential Smoothing • Comparison of Simple Moving Average and Exponential Smoothing
Time Series Methods • In this lesson we shall discuss some time series forecasting methods. All methods discussed in this lesson are designed for stationary series. Recall from the previous lesson that a stationary series contains only the average and no trend, seasonality, cyclicity, etc. • No method is superior to any other method in every context. In a particular context, various methods can be used and evaluated using a suitable measure (e.g., MAD, MSE, MAPE etc.) discussed in the previous lesson. Then, it is possible to use the method that works best in that context. See the Taco Bell example. • A comparison among the methods is done near the end of the lesson.
Time Series Methods • All these methods will be illustrated with the following example: Suppose that a hospital would like to forecast the number of patients arrival from the following historical data: Week Patients Arrival 1 400 2 380 3 411 4 415 • Note: Although week 4 data is given, some methods require that forecast for period 4 is first computed before computing forecast for period 5.
450 — 430 — 410 — 390 — 370 — Patient arrivals Actual patient arrivals | | | | | | 0 5 10 15 20 25 30 Time Series MethodsSimple Moving Average A moving average of order N is simply the arithmetic average of the most recent Nobservations. For 3-week moving averages N=3; for 6-week moving averages N=6; etc. Week
Time Series MethodsSimple Moving Average 450 — 430 — 410 — 390 — 370 — Patient Week Arrivals 1 400 2 380 3 411 Given 3-week data, one-step-ahead forecast for week 4 or two-step-ahead forecast for week 5 is simply the arithmetic average of the first 3-week data Patient arrivals | | | | | | 0 5 10 15 20 25 30 Week
Time Series MethodsSimple Moving Average 450 — 430 — 410 — 390 — 370 — Patient Week Arrivals 1 400 2 380 3 411 Patient arrivals | | | | | | 0 5 10 15 20 25 30 Week
Time Series MethodsSimple Moving Average 450 — 430 — 410 — 390 — 370 — Patient Week Arrivals 1 400 2 380 3 411 Patient arrivals | | | | | | 0 5 10 15 20 25 30 Week
Time Series MethodsSimple Moving Average One-step-ahead forecast for week 5 is computed from the arithmetic average of weeks 2, 3 and 4 data 450 — 430 — 410 — 390 — 370 — Patient Week Arrivals 2 380 3 411 4 415 Patient arrivals | | | | | | 0 5 10 15 20 25 30 Week
450 — 430 — 410 — 390 — 370 — 3-week MA forecast Patient arrivals Actual patient arrivals | | | | | | 0 5 10 15 20 25 30 Week Time Series MethodsSimple Moving Average
450 — 430 — 410 — 390 — 370 — 6-week MA forecast 3-week MA forecast Patient arrivals Actual patient arrivals | | | | | | 0 5 10 15 20 25 30 Time Series MethodsSimple Moving Average Week
Taco Bell determined that the demand for each 15-minute interval can be estimated from a 6-week simple moving average of sales. The forecast was used to determine the number of employees needed.
Time Series MethodsWeighted Moving Average In the simple moving average method each of the N periods is equally important for the purpose of forecasting. Weighted moving average is more general than the simple moving average and assigns different weights to different periods. Let, Then, the one-step ahead forecast for period t
Assigned weights t-1 0.70 t-2 0.20 t-3 0.10 Time Series MethodsWeighted Moving Average 450 — 430 — 410 — 390 — 370 — 3-week MA forecast Weighted Moving Average Patient arrivals | | | | | | 0 5 10 15 20 25 30 Week
Assigned weights t-1 0.70 t-2 0.20 t-3 0.10 Time Series MethodsWeighted Moving Average 450 — 430 — 410 — 390 — 370 — 3-week MA forecast Weighted Moving Average Patient arrivals | | | | | | 0 5 10 15 20 25 30 Week
Time Series MethodsExponential Smoothing • Exponential smoothing method computes a forecast value which is the weighted average of the most recent data and forecast values. • The weight assigned to the most recent data is called the smoothing constant, and the weight assigned to the most recent forecast is (1- ). • The method requires an initial forecast value. The initial forecast value may be obtained by some other forecasting technique. • If the smoothing constant, is large, the forecast values fluctuate with the actual data. If is small, the fluctuation is less.
Time Series MethodsExponential Smoothing • The one-step-ahead forecast for period t • Notice that therefore, • With further expansion of the expression for forecast for period t it can be seen that the forecast for period t depends on all previous data!!
Time Series MethodsExponential Smoothing 450 — 430 — 410 — 390 — 370 — Exponential Smoothing = 0.10 Ft = Dt-1 + (1 - )Ft - 1 Patient arrivals | | | | | | 0 5 10 15 20 25 30 Week
Time Series MethodsExponential Smoothing 450 — 430 — 410 — 390 — 370 — Exponential Smoothing = 0.10 Ft = Dt-1 + (1 - )Ft - 1 Initial forecast value F3 = (400 + 380)/2=390 D3 = 411 Patient arrivals | | | | | | 0 5 10 15 20 25 30 Week
Time Series MethodsExponential Smoothing 450 — 430 — 410 — 390 — 370 — Exponential Smoothing = 0.10 Ft = Dt-1 + (1 - )Ft - 1 Initial forecast value F3 = (400 + 380)/2=390 D3 = 411 Patient arrivals | | | | | | 0 5 10 15 20 25 30 Week
Time Series MethodsExponential Smoothing 450 — 430 — 410 — 390 — 370 — Exponential Smoothing = 0.10 Ft = Dt + (1 - )Ft - 1 F4 = 392.1 D4 = 415 Patient arrivals | | | | | | 0 5 10 15 20 25 30 Week
450 — 430 — 410 — 390 — 370 — Patient arrivals | | | | | | 0 5 10 15 20 25 30 Week Time Series MethodsExponential Smoothing
Comparison of Exponential Smoothing and Simple Moving Average • Both Methods • Are designed for stationary demand • Require a single parameter • Lag behind a trend, if one exists • Have the same distribution of forecast error if
Comparison of Exponential Smoothing and Simple Moving Average • Moving average uses only the last N periods data, exponential smoothing uses all data • Exponential smoothing uses less memory and requires fewer steps of computation; store only the most recent forecast!
READING AND EXERCISES Lesson 5 Reading: Section 2.7, pp. 66-77 (4th Ed.), pp. 63-73 (5th Ed.) Exercises: 17, 18, 24, pp. 69, 75-76 (4th Ed.), pp. 66, 72 (5th Ed.)