Download
1 / 51
520 likes | 642 Views
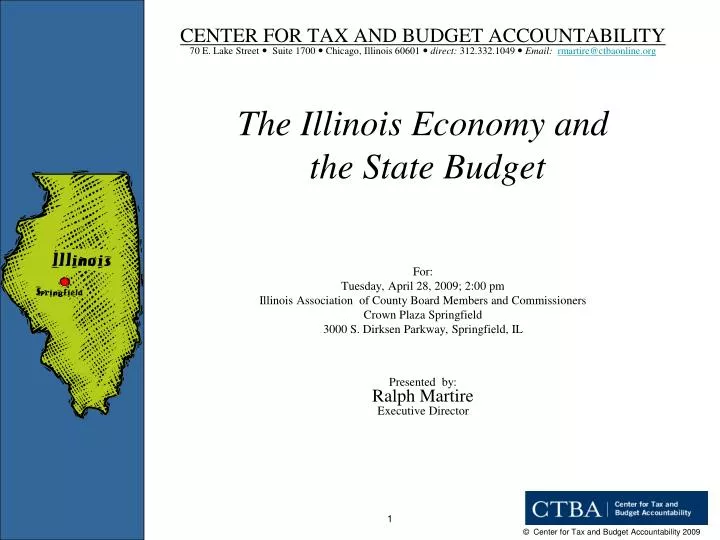
CENTER FOR TAX AND BUDGET ACCOUNTABILITY 70 E. Lake Street Suite 1700 Chicago, Illinois 60601 direct: 312.332.1049 Email: rmartire@ctbaonline.org The Illinois Economy and the State Budget For: Tuesday, April 28, 2009; 2:00 pm

E N D
CENTER FOR TAX AND BUDGET ACCOUNTABILITY70 E. Lake Street Suite 1700 Chicago, Illinois 60601 direct: 312.332.1049 Email: rmartire@ctbaonline.org The Illinois Economy and the State Budget For: Tuesday, April 28, 2009; 2:00 pm Illinois Association of County Board Members and Commissioners Crown Plaza Springfield 3000 S. Dirksen Parkway, Springfield, IL Presented by:Ralph MartireExecutive Director
The Starting Point: Illinois State Government is in the worst fiscal crisis since the Great Depression • the backlog of unpaid bills was almost $2 billion as of 12-31-08 • Payment cycle is 48 days • Comptroller Hynes notes both are record highs for midpoint of a fiscal year NOT SINCE FDR
GRF Expenditures by Category, 1995 - 2006 **Notes: Health care includes Medicaid and state employee health insurance Sources: State of Illinois' Traditional Budgetary Financial Reports and Fiscal Focus Illinois' FY2006 Budget National Association of State Budget Officers Comptroller Fiscal Focus, January 1997 CPI and ECI based on Bureau of Labor Statistics
A SNAPSHOT OF WHAT IS Illinois State & Local Revenue • In 2005 (the most recent national comparison available), state and local revenue came from the following sources: PROPERTY TAX 38% SALES TAX 17% EXCISE TAX 17% INDIVIDUAL INCOME TAX 16.2% OTHER 7.4% CORPORATE INCOME TAX 4.4% SOURCE: Federal Tax Administrators Data PROPERTY TAX RELIANCE
This makes Illinois the 6th most reliant state on property tax revenue in the nation. • Illinois is more reliant on property taxes than Florida, Nevada, Tennessee, Alaska, South Dakota, Washington and Wyoming – which also don’t have income taxes. PROPERTY TAX RELIANCE
WHY – EDUCATION • Illinois ranks 49th out of 50 states in the portion of education funding covered by state – versus local – revenuejust 28% of the cost. • Illinois is the most reliant state on property taxes to fund schools in the nation. (National Education Association Data) PROPERTY TAX RELIANCE
THE BURDEN IS TOUGH All data inflation adjusted to 2008 Income Data: US Department of Census Property Tax Data: IL Department of Revenue
The Context: BIG ‘N RICH • In 2007, Illinois ranked fifth nationally with a Gross State Product in excess of $609 billion. • That would be the 27th largest economy of any nation in the world-greater than Egypt, Saudi Arabia, Colombia, Belgium, Sweden, Greece, Ireland, Portugal, Norway and Nigeria, to name a few. ILLINOIS’ ECONOMY IS LARGE
Illinois GDP Growth Lags THE ILLINOIS ECONOMY Source: Bureau of Economic Analysis, US Dept. of Commerce
Between 1990 and January 1, 2008, Illinois lost 27% - 249,000 - of its manufacturing industry jobs. • This loss was worse than both the Midwest (-23.2%) and the Nation (-23.9%). • Illinois lost another 243,000 jobs overall from December 2007 - December 2008. MANUFACTURING DECLINE
For over two decades now: • All job growth in Illinois came in the service sector. • For the most part, service sector jobs that pay less than manufacturing • On average, most of these service jobs pay 29% less than the manufacturing jobs they replace LOW-END SERVICEJOBS GROW
Employer-provided health insurance benefits have been steadily declining in Illinois since 1980. • By 2006, over 40% of the workforce didn’t have employer provided insurance • Hispanics especially hard hit–over 57% do not have employer-provided insurance • TODAY, 27% of the Illinois population is either on Medicaid or uninsured EMPLOYER-PROVIDED BENEFITS
In 1981, 55.6% of the state’s workers were covered by private sector employer-provided pension plans. • By 2007, only 43.8% of the workforce had private retirement benefits. PENSION EROSION
Why the Economic Problems? • NOT TAX BURDEN OR WASTEFUL SPENDING • Illinois’ total state AND local tax burden, as a percentage of personal income ranks only 45th in the nation. • The second lowest tax burden in the Midwest to Missouri (Missouri is all of one-tenth of one percent lower). • Illinois also ranks only 42nd in spending among the states ILLINOIS IS LOW TAX OVERALL
Education now matters more than ever to economic prosperity: unemployment rates are highest for those with the least education. Wages are also tied to education levels. EXHIBIT “A” IS EDUCATION
Impact of Education on Wages • In real (2006) dollars, between 1980 and 2006, only those with at least a college degree experienced any gain in hourly income, with growth of 14.3% • Real median hourly wages for all other education categories declined • Less than a high school diploma fell by 28.7% • Only a high school education declined 8.7% • Some college but no degree declined 4.3% • You gotta learn to earn! WAGE DIFFERENCES
Wages for Minorities lag Whites • Real wages for Whites increased modestly between 1980 and 2007, but : • The White-Hispanic wage gap is larger in amount, but increased by a smaller percentage, growing from $3.82 in 1980 to $5.34 in 2007, an increase of 39.7% over 1980 • Real wages for African-Americans declined. The hourly wage gap between Whites and African-Americans grew from $1.52 in 1980 to $3.44 in 2007, an increase of 126.3% over 1980 WAGE DIFFERENCES
Still Separate. . . . • Illinois is the third most segregated state in K-12 education for blacks • 82% of black children attend majority/minority schools • 90% of white children attend virtually all white schools (*Source: 2006 Education Trust study on segregation) SEGREGATION
. . . . Still Unequal • Minority school districts start out with $1,154 less per child to spend on education • That’s the second worst gap in the nation (*Source: 2006 Education Trust study on segregation) SEGREGATION
Current Basis for Foundation Level • The Illinois state “Foundation Level” is the minimum per child guaranteed expenditure for K-12 • Does NOT include: poverty, special ed, transportation, etc. • For FY2008: $5,734 – but not tied to any measurable standard K-12 FUNDING
Education Funding Advisory Board (“EFAB”) • Change basis to a measurable outcome standard, predicated on costs and test results • Foundation Level should be at least $7,330 (after adjusting for inflation) • Total cost: $1.8 billion EFAB
SCHOOL DISTRICT TYPE Equalized Assessed Valuation (EAV) is a proxy for a school district’s local property wealth available to be taxed. The average EAV of flat grant districts is more than 5 times greater than foundation-formula districts. http://www.isbe.net “2007 Illinois Report Card”
MONEY MATTERS http://www.isbe.net “2007 Illinois Report Card”
Total and Instructional Spending Differentials • On average, Flat Grant districts spend $4186 more in total per pupil spending than Foundation Formula school districts. • When it comes to instructional expenses, Flat Grant districts spend $2324 more per student on average than do Foundation Formula districts. MONEY MATTERS http://www.isbe.net “2007 Illinois Report Card”
YEAH, $ DOES APPEAR TO MATTER *Linear regression is a statistical analysis that shows the correlation of two or more variables, in this case, how per-pupil expenditures correspond to ISAT test scores. The regression line (heavy red) represents the predicted test score results a school district should obtain, given a specific level of instructional expenditure.
LOW INCOME http://www.isbe.net “IL State Report Cards”
MONEY MATTERS The percentage of students meeting or exceeding ISAT standards in the districts with the lowest levels of poverty is markedly different from those districts with the highest levels of poverty. http://www.isbe.net “2007 Illinois Report Card”
Governor Quinn faces: the Great Recession; a hugely inequitable education funding system, and a big deficit:
Federal Bailout is No Panacea • One time revenue – not replaceable after being spent • Provides temporary budget relief of about $7B over 2 years, as follows: • K-12 education; $1.66 B • Medicaid - $2.9 B (over 2 years) • Other Education - $1.9 B (over 2 years, spec. ed, poverty, modernization, higher ed) • The rest for job training, food stamps, emergency shelter, etc. FEDERAL BAILOUT
If the bailout gets spent and the revenue is not replaced by state tax reform, the deficit comes back – worse – in two short years HEY, BIG SPENDER
Governor Quinn Proposes: • Raising the personal income tax from 3% to 4.5%; • Increasing the personal/dependent exemption to $6,000; • Raising the corporate income tax rate from 4.8% to 7.2%; • Cutting public employee pension funding by $2.846B (over two years); • Other spending cuts of $1.459B
What’s Missing??? • Sustainability • Education Funding Reform • More Targeted Relief
REAL PROBLEM:What About Revenue Growth $ $ $ $ NEW $$$ ?
NOT SO MUCH
WHAT SHOULD BE: FAIR PROGRESSIVE RESPONSIVE TO MODERN ECONOMY STABLE DURING POOR ECONOMIES EFFICIENT DOESN’T DISTORT PRIVATE MARKETS ELEMENTS OF A SOUND AND FAIR FISCAL SYSTEM BUT ISN’T
The Illinois Structural Deficit (How Revenue Growth Will Not Keep Pace With The Cost of Current Services) $49 Billion Revenue Expenditures $44 Billion $39 Billion $34 Billion $29 Billion $24 Billion 2006 2007 2008 2009 2010 2011 2012 2013 2014 2015 2016 2017 2018 2019 2020 2021 2022 2023 2024 2025 2026 WHICH CREATES: STRUCTURAL DEFICIT *Adjusts solely for historic rates of inflation and population growth, and assumes normal economic growth.
SB750 is designed to: • Be sound tax policy for the modern, capitalist economy • Make tax burden fairer, by making it more progressive―the bottom 60% of income earners won’t pay more in taxes after SB750 passes • Improve school funding by • Raising the foundation level • Enhancing special education funding • Targeting $300M in additional funds to struggling schools • Investing $300M more per year in higher education • Eliminate the Unfunded Pension Liability • Provide progressive property tax relief statewide, that effectively helps struggling communities while reducing fixed costs for business • Keep Illinois’ status as a low tax state SB750
THIS HELPS STATE & LOCAL Source: Center for Tax and Budget Accountability calculation based on final FY2009 revenue assumptions by the Illinois Commission on Government Forecasting and Accountability.
Income Growth in the United States 1979-1999 (Real 1999 Dollars) *Source U.S. Census Data Fair? Responsive? 100% 93.4% Percent Change 80% 60% 50.20% 33.20% 40% 20% 5% 0% -20% -6% Next 20% Top 20% Top 15% Top 1% Bottom 60% INCOME INEQUALITY
Fair? Responsive? State & Local Tax Burden as a Percentage of Income REGRESSIVE
INCOME TAX INCREASE 3% 5% 3% 2% = 5% 2/3 = 67% *Note, corporate rate goes up from 4.8% to 8%, but―overall corporate tax burden goes down! SB750
This will also generate about $590 million* annually for local governments! (*COGFA Estimate) ALL BENEFIT