Download
1 / 35
350 likes | 674 Views
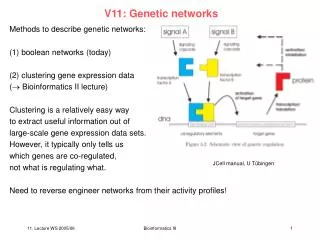
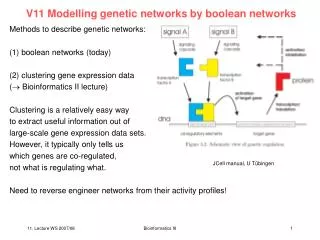
Genetic Networks (genetic regulatory networks). - a group of genes connected through transcription regulators encoded within the set of genes. Promoter X. gene X. Promoter Y. gene Y. operator X. Genetic Networks (genetic regulatory networks).

E N D
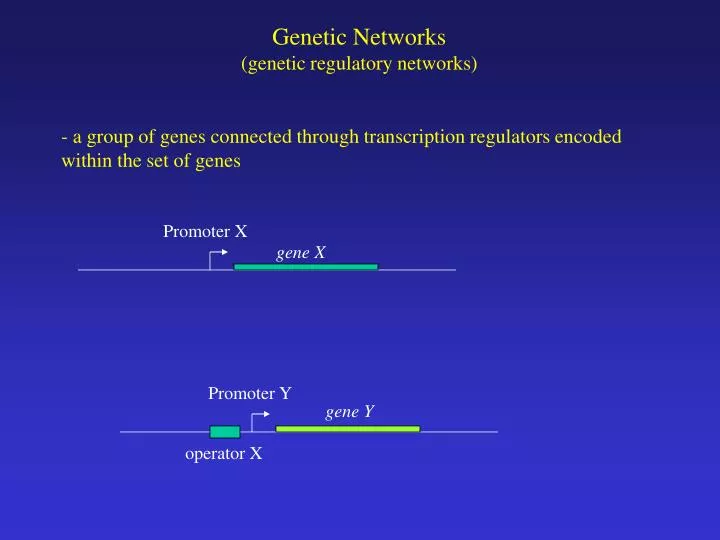
Genetic Networks (genetic regulatory networks) - a group of genes connected through transcription regulators encoded within the set of genes Promoter X gene X Promoter Y gene Y operator X
Genetic Networks (genetic regulatory networks) - a group of genes connected through transcription regulators encoded within the set of genes gene X X gene Y
Genetic Networks (genetic regulatory networks) - a group of genes connected through transcription regulators encoded within the set of genes gene X X gene Y X Y
Genetic Networks (genetic regulatory networks) By convention we simplify these diagrams as follows: gene X X X gene Y Y X Y
Genetic Networks (genetic regulatory networks) X Y Denotes positive regulation Denotes negative regulation Y Z
Regulation of flagella gene expression: A three tiered transcriptional hierarchy Positive transcriptional regulators Alternative sigma factors Anti-sigma factors Temporal regulation
The Flagella Transcription Hierarchy CRP,H-NS,OmpR other? 1. The Master Regulon FlhCD
The Flagella Transcription Hierarchy CRP,H-NS,OmpR other? 1. The Master Regulon 2. The FlhCD Regulon FlhCD inside outside Basal Body and Hook FlgM FliA other?
The Flagella Transcription Hierarchy CRP,H-NS,OmpR other? Chemotaxis proteins 1. The Master Regulon 2. The FlhCD Regulon 3. The FliA Regulon Motor proteins FlhCD inside outside Basal Body and Hook FlgM FliA other? Filament
The flhDC promoter integrates inputs from multiple environmental signals flhDC ? CRP - catabolite repression, carbohydrate metabolism OmpR - osmolarity IHF - growth state of cell? HdfR - ?
FliA Regulation by FlgM FlhDC expression leads to activation of Level 2 genes including the alternative sigma factor FliA and an anti sigma factor FlgM FlgM accumulates in the cell and binds to FliA blocking its activity (i.e. interaction with RNA polymerase) preventing Level 3 gene expression. Level 3 Genes inside outside
FliA Regulation by FlgM Other level 2 genes required for Basal body and hook assembly are made and begin to assemble in the membrane. Level 3 Genes inside outside Basal Body and Hook Assembly
FliA Regulation by FlgM The Basal body and hook assembly are completed. Level 3 Genes inside outside Completed Basal Body and Hook
FliA Regulation by FlgM The Basal body and hook assembly are completed. FlgM is exported through the Basal Body and Hook Assembly Level 3 Genes inside outside Completed Basal Body and Hook
FliA Regulation by FlgM Level 3 gene expression is initiated. FliA can interact with RNA polymerase and activate Level 3 gene expression. FlgM is exported through the Basal Body and Hook Assembly. Level 3 Genes inside outside Completed Basal Body and Hook
FliA Regulation by FlgM Level 3 gene products are added to the motility machinery including the flagella filament, motor proteins and chemotaxis signal transduction system. inside outside Filament
The “genetic network diagram” for the fla system flhCD Level 1 fliL fliE fliF flgA flgB flhB n = 6 flgM fliA Level 2 fliD flgK fliC meche mocha flgM n = 6 Level 3
Using reporter genes to measure gene expression RNA polymerase Regulator Organization of operon on chromosome. flhD flhC flhDC promoter
Using reporter genes to measure gene expression RNA polymerase Regulator Organization of operon on chromosome. flhD flhC flhDC promoter Clone a copy of the promoter into a reporter plasmid. Reporter gene
Using reporter genes to measure gene expression RNA polymerase Regulator flhD flhC Both the flhDC genes and the reporter plasmid are regulated in the same way and thus the level of the reporter indicates the activity of the promoter. Reporter gene Note that the strain still has a normal copy of the genes.
Gene Expression in Populations Gene Expression in Single Cells Multi-well plate reader - sensitive, fast reading - high-throughput screening - liquid cultures - colonies - mixed cultures Video microscopy - “individuality” - cell cycle regulation - epigenetic phenomenon Automation: Both approaches are amenable to high throughput robotics
Gene Expression in Single Cells: Cell to Cell Variability Michael Elowitz, Rockefeller University
1- Gene Expression Profiling With Real Promoters Modeling Genetic Networks - from small defined systems to genome wide - Small Defined Networks High Throughput / High Quality Expression Profiling Modeling, Simulation
Class Operon Fluorescence of flagella reporter strains as a function of time Fluorescence relative to max 0.6 0.1 0.01 0 600 Time [min]
The order of flagellar gene expression is the order of assembly Early Class 1 flhDC Master regulator Cluster 1 Class 2 fliL Class 2 fliE Class 2 fliF Class 2 flgA Class 2 flgB Class 2 flhB Class 2 fliA Cluster 2 Activator of class 3 Class 3 fliD Class 3 flgK Class 3 fliC Class 3 meche Class 3 mocha Class 3 flgM Cluster 3 Late
Simple Mechanism for Temporal Expression Within an Regulon Induction of positive regulator [protein] Time Promoters with decreasing affinity for regulator
Simple Mechanism for Temporal Expression Within an Regulon [protein]
Using Expression Data to Define and Describe Regulatory Networks With the flagella regulon, current algorithms can distinguish Level 2 and Level 3 genes based on subtleties in expression patterns not readily distinguished by visual inspection. Using our methods for expression profiling (sensitive, good time resolution) we have been able to demonstrate more subtle regulation than previously described. Different mechanisms can give rise to different patterns- in this case temporal patterns arise by transcription hierarchies (I.e. Level 1 Level 2 Level 3) and by differences in binding site affinities within a level. “You can not infer mechanism from pattern.”
The problem of binding sites: Aoccdrnig to a rscheearch at an Elingsh uinervtisy, it deosn't mttaer in waht oredr the ltteers in a wrod are, the olny iprmoetnt tihng isThat frist and lsat ltteer is at the rghit pclae. The rset can be a toatl mses and you can sitll raed it wouthit porbelm. Tihs is bcuseae we do not raed ervey lteter by it slef but the wrod as a wlohe. Ceehiro That'll srecw the splelchekcer
C A B D E F Methods such as the one described here or DNA microarrays can be used to measure expression of all the genes in a cell simultaneously. Reverse Engineering challenge – can we use expression data to infer genetic networks? M N X Y Z O W V U
Engineered Gene Circuits: The Repressilator • A 3-element negative feedback transcriptional loop that should have sustainedoscillatory behavior under the appropriate conditions: • strong promoters. • tight transcription repression with low leakiness. • comparable protein and mRNA decay rates Michael Elowitz & Stanislas Leibler Nature, 2000
Engineered Gene Circuits: The Repressilator • Periodic synthesis of GFP (150 minutes, 3x cell cycle time) • The state of the network is transmitted to the siblings • Average decorrelation time = 95 +/- 10 minutes
Some lessons learned: • Even well studied systems still have elements of surprise! • The best engineered systems do not always live up to there predicted behavior (we often do not know as much as we think!). • Predictive ability is limited because of difficult in predicting quantitative properties. • The interfacing of modeling with experiments reveals much more information about biological systems that neither will do alone.