Download
1 / 31
330 likes | 525 Views
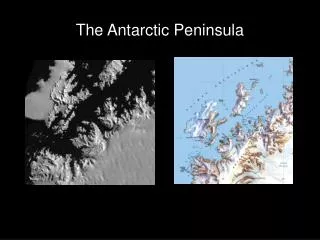
Recent decades of climate and cryospheric change on the Antarctic Peninsula. David G. Vaughan British Antarctic Survey. Climate Warming - Antarctica. Source: Vaughan et al. Climatic Change, 2002. Antarctic Peninsula melt - Mean annual air temp. Part 1 - More melt…

E N D
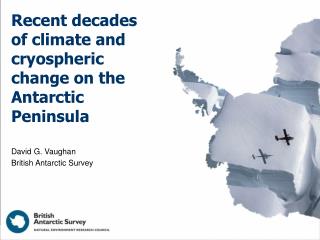
Recent decades of climate and cryospheric change on the Antarctic Peninsula David G. Vaughan British Antarctic Survey
Climate Warming - Antarctica Source: Vaughan et al. Climatic Change, 2002
Part 1 - More melt… Vaughan, D.G., 2006: Recent trends in melting conditions on the Antarctic Peninsula and their implications for ice-sheet mass balance. Arctic, Antarctic and Alpine Research, 38(1), pp. 147-152.
Faraday/Vernadsky mean annual temperature Source: BAS
Faraday/Vernadsky – seasonal trends Source: BAS
Antarctic Peninsula Fossil Bluff 1985/86 Fossil Bluff 1996/97 Source: DGV
…quantitative – Rothera ramp Source: Andy Smith
Parameterisation of ann. temp vs. PDDs Figure 3. Correlation of mean annual air temperature to positive degree-days for all Antarctic Peninsula station data. East coast sites are represented by open circles and have a best fit regression line (solid) of, Φ = 1089 e (0.261 T / ˚C) (r2 = 0.84). West coast sites are represented by black triangles and have a best-fit regression line (dashed) of, Φ = 358 e (0.251 T / ˚C) (r2 = 0.79).
Melt-day distribution 1950 2000 2050 Figure 4. Distribution of annual positive degree-days calculated for a. 1950 (i.e. 2000 – 2.5˚C), b. 2000 and c. 2050 (i.e. 2000 – 2.5˚C).
Conclusions • Long-term meteorological station data show increased duration of melt conditions across the Antarctic Peninsula over the past 50 years • Parameterization of the number of PDDs as a function of mean annual temperature allows mapping of change • Increasing surface ablation was estimated and shown to be likely to have doubled between 1950 and 2000, and given continued summer warming could double or treble by 2050. • Runoff was calculated. At present it is (0.008 - 0.055) mm a-1 of sea level rise with the likelihood that with continued warming it will perhaps treble within 50 years. Increasing uncertainty
Part 2 - Shortening glaciers… Cook, A., A.J. Fox, D.G. Vaughan, and J.G. Ferrigno, 2005: Retreating glacier-fronts on the Antarctic Peninsula over the last 50 years. Science, 22, pp. 541-544.
Sheldon Glacier 1957 1969 1998 1986 2001
Analysis of glacier-front changes 1970- 1974 1975- 1979 1980- 1984 1985- 1989 1990- 1994 1995- 1999 Extract from table showing mean change per year observed in 5-year intervals
Latitude Sectors
Part 3 - Faster glaciers… H. Pritchard and D.G. Vaughan, in prep.
measurement = (glacier flow) & (orbit offset) random error systematic error Tracking features in radar (SAR) images SAR1 +35 days SAR2
Tracking error: the case for azimuth-direction data 1) Range direction 2) range Azimuth direction azimuth 1 5
0 md-1 4 0 15 30 Tracking features in radar (SAR) images • 150 scenes • 70 000 km2 • 337 glaciers • 9 summers
Change in flow speed 1993 to 2003
+8% 64°S +14% 10 % 0 +14% +13% +13% 68°S Retreat rate Cook et al. (2005)
Conclusions • Significant, widespread speed-up • Appears driven by retreat • Response to strong regional warming
Antarctic Peninsula contribution to sea level: • AP runoff: up to 0.06 mm /yr • Shelf collapse (Rignot et al. 2004): 0.07 mm /yr • AP flow imbalance (12%, 1993-2003):at least0.06 mm /yr • Total:0.19 mm /yr Conclusions Alaska melt(Arendt et al. 2002):0.14 mm/yr