Download
1 / 18
180 likes | 301 Views
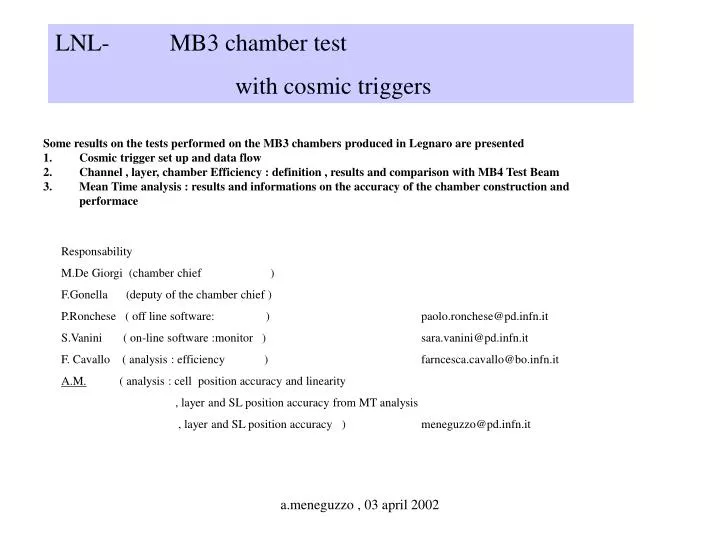
LNL- MB3 chamber test with cosmic triggers. Some results on the tests performed on the MB3 chambers produced in Legnaro are presented Cosmic trigger set up and data flow

E N D
LNL- MB3 chamber test with cosmic triggers • Some results on the tests performed on the MB3 chambers produced in Legnaro are presented • Cosmic trigger set up and data flow • Channel , layer, chamber Efficiency : definition , results and comparison with MB4 Test Beam • Mean Time analysis : results and informations on the accuracy of the chamber construction and performace Responsability M.De Giorgi (chamber chief ) F.Gonella (deputy of the chamber chief ) P.Ronchese ( off line software: ) paolo.ronchese@pd.infn.it S.Vanini ( on-line software :monitor ) sara.vanini@pd.infn.it F. Cavallo ( analysis : efficiency ) farncesca.cavallo@bo.infn.it A.M. ( analysis : cell position accuracy and linearity , layer and SL position accuracy from MT analysis , layer and SL position accuracy ) meneguzzo@pd.infn.it a.meneguzzo , 03 april 2002
Data Flow & Software -Legnaro set up The DAQ system developed by XDAQ on the TRIDAS project– the same used in the Test Beam 2000 and 2001 and at ISR- is used . Data can be written :on Flat File , on Data Base Objectivity on Data Base Objectivity and Flat File Now in Legnaro data are stored only in Data Base Objectivity ; in next future data will be saved in flat file and . Data Base Objectivity MONITOR :on line analisys –occupancy -noise -t0’s -MT -Event Display ORCA 3 framework Analisys Off-line: -track reconstruction -ntuples production with -raw and tracks information ORCA 3 framework The system is quite complex but : -it is checked , -it is strong , -it is working quite fast -all is parametrized (can be used for mb1, mb2,mb3,mb4) -it includes RPC (Test Beam and ISR) Efficiency.... MT .....( layer and SL construction accuracy ) Tracks (Shifts and/rotations of layers and Phi SLs) a.meneguzzo , 03 april 2002
MB3 cosmic trigger in LNL ( E. Conti set up ) The cosmic trigger set up consist of 4 sets of Scintillators SC each one made with 2 parralel slices of scintillator read out in both sides by individual PMs. The coincidence of the Mean Time of the PM signals of each slice yelds the trigger. There are two SC parallel to the PHI wires (SC 1 and SC 4) and two SC parallel to the Theta wires. The PM=5 is near the FE side of the PHI Superlayers, the PM=4 is near the Theta FE side . There is enougth TDC channel to read or just 1 total PHI and the Theta SL or half of the both PHI Superlayers and the Theta SL. The accuracy of the trigger has been measured to be better than ~3 ns for SC5 and SC6. along all the scintillator. They will be setAll in time each other respect cosmic signals . 57st theta wire The signals of all the PMs and of the MT coincidences are also recorded with the TDC in order to better study the performance of the chamber SC 6 PHI 2 THETA SC 5 1st theta wire,FE side PHI 1 wire72 • 1st wire, FEside SC 1 SC 4 a.meneguzzo , 03 april 2002
COSMICS The trigger efficiency of the scintillators (SC) is of the order of 75% . A cosmic run of few hours allows to have a quite large amount of triggers all along the chamber .See the last plots for angular acceptance and uniformity along the scintillators. From cosmic trigger data we compute ( on line first and off line after ) -the noise of each channel (the number of hits divided the total time gate i.e. the #of events *0.032 milliseconds in Legnaro ), -the noisy channels (above 1KHz and above .5KHz), -for each Layer the Mean of the noise of the channels with less the 0 .5KHz and its R.M.S. Off line i.e after track recostruction -the inefficiency of all cells of all layers -the inefficiency of each layer -the mean value and the RMS of the Mean Timer MT123 and MT234 of all the 3 SL as a function of the position in the SL and of the position of the track in the SL at 90 degrees (ie of the track along the wire in the SL). -from the track parameters reconstructed separately in the two SL s, the relative displacements of the two SLs and of the layers in the SL. -All such informations can be saved , and will be recorded at the nominal HV value (–3720 V on the wire al LNL) a.meneguzzo , 03 april 2002
INEFFICIENCY Tracks are reconstructed separetly in the 3 SL using fix drift velocity (usually Tmax =367*1.04 ns at LNL ) with at least 3 hits in different layers with Chi-2< 100 . This loose track selection is used as pattern recognition of drift times and cells belonging to the same track. The efficiency and the MT analisys accuracy do not depends on the accuracy of drift velocity used . Displacements of the SLs instead are strogly correlated to the accuracy of the track parameters and so on the drift velocity accuracy. INEFFICIENCY –for the tracks with an angle < 45 degrees respect to the normal to the chamber # of tracks pointing at cell j with no hits within 4.2 cm Cell j inefficiency in each layer= ------------------------------------------------------------------ # of tracks with at least all the others 3 layers in the SL pointing at cell j # of tracks with no hits within 4.2 cm* layer inefficiency in each SL = ------------------------------------------------------------------ # all tracks with at least all the others 3 layers of the SL It must point out that the effeciency we report is relative to the reconstructed tracks but the track efficiency is almost 100% from test beam due to the loose chi2 cuts.Checks were performed also changing the drift velocity . * cells with an inefficiency greater then an inefficiency cut set at 0.10 are not considered . a.meneguzzo , 03 april 2002
Inefficiency yeld Informations on : HV on the strips, on the cathod and on the wires taking into account the modularity of the HV connections and of the time boxes shape. Efficiency plots of MB3_004 at HV 1300/-1800/3720 volts at fix 1020 mbar pressure (only half phi SL read-out here). a.meneguzzo , 03 april 2002
MB3 Layer inefficiency versus HV on the wire, 1800 V on strips and -1300 V on I-b . MB2 Test Beam( beam perpendicular to the chamber ) :Layer inefficiency versus HV on the wire , 1800 V on strips and -1300 V on I-b . NB only the 8 cells hit by the beam are considered a.meneguzzo , 03 april 2002
The cell inefficiency is in the zone near the I-B. NB The position error due to the extrapolation of the reconstructed track to a layer is of the order of some hundred of micron depending on the layer wire I-Beam a.meneguzzo , 03 april 2002
MB3_03: Preliminary :Means and RMS of the noise of the cells - layer by layer -as a function of HV on the wire (cells above .5 kHz excluded). For the PHI SL only half of the cells were read out on the runs used for the analisys below. The test beam data on MB2 can not really be compared for the difference on the trigger and on the environemment situation. The noise inceases with the HV on the wire.(see Marco De Giorgi trasparencies) a.meneguzzo , 03 april 2002
Mean Time From the analisys of the two MT computed with the times recorded in each SL and correlated to the same track we check : -the HV connection (as from the occupancy and from the cell efficiency ) -the uniformity of the drift velocity on the full chamber size(as from the time boxes ) -the uniformity of the cells along the layer (as from the time boxes ) -the position of a layer with respect to the others on the same SL from the asymmetry of the MTs when the track is on the First half cell or second half cell. Signal Propagation along the wire The MT analysis is performed once the drift times are corrected for the delay of the signal propagation along the wire. Such a correction can be achived using the position of the track in the SL at 90 degrees. In the next plot the mean of the MT distribution of a Theta SL is computed and plotted as a function of the position found in the Phi_2 SL . The measured delay due to the proagation along the wire of each signal is ~3.6 ns/meter. It must point out that such a correction can not be performed on the BTI but will appear at the BTI as a common phase of all the wire signals of the track (see TN 051/2001 figure 4 and figure 9 for the effect on the BTI trigger efficiency). MeanTime computation: MT123 (mean time layer 1 2 3 ) and the MT234 (mean time layer 2 3 4 ) are computed and plotted as a function of a) the semicell number in the SL at 90 degrees-- MT uniformity along the wires after propagation time corrections. b)--the semicell number in the second layer of its SL --- MT uniformity of all wires in the SL. c)-the mean and the RMS of the MT distribution of each semicells as a function of HV->drift velocity d)-the angle of the track in the plane normal to wires e)- the angle of the track in the plane normal to wires f)- the position of the track inside the cell a.meneguzzo , 03 april 2002
MT uniformity in the SL as a function of position along the wire. Positions are in cm. MT in TDC units (1 bit=1.04 ) MB3_004 data . Before wire proagation time correction after wire proagation time correction The time measured by each phi layers are first corrected for the wire propagation (from the position on the theta plane) and viceversa (time of theta layers are corrected for the position on the phi plane) . a.meneguzzo , 03 april 2002
b) MT Mean and RMS : uniformity in the SL as a function of the semicell of the SL. Positions are in cm. MT in TDC units (1 bit=1.04 ns). The MT mean value is flat as a function of the semicell position.If Righ and left semicells have the same MT mean value distribution- the layers are all aligned; if not there is one or more layer not aligned as in the example (layer 2 is displaced of 120 microns). SL1 The MEAN value of th MT of all the left semicells and of all the right semicells are plotted separatly (first and second plots ) and their difference as well (last plot). In the third and fourth plot the RMS of all the left semicells and of all the right semicells are plotted separatly . From this plots cuts can be evetually set . MT Mean and RMS (MB3_004 chamber) SL3 a.meneguzzo , 03 april 2002
c) MB3 _003 : Mean value of the mean of the MT 1 (layer 1 2 3) and MT 2 (layer 2 3 4) for the different semicells for tracks with less then 45 degrees but with all the four hits in the same semicell . The mean value of the MT of all events gives the same result. HV strip=1800V, Hv I_beam=-1300 MT_Mean MT_Sigma a.meneguzzo , 03 april 2002
MB3_003 :difference between the mean of MT 1 (layer 1 2 3) for the tracks in the semicell right and the mean of MT 1 (layer 1 2 3) for the tracks in the same semicell left (and anyway with less then 45 degrees). In this chamber for the SL=2 a non zero shift of a layer (probably layer 2) of 100 micron is measurable. HV strip=1800V, Hv I_beam=-1300 a.meneguzzo , 03 april 2002
Test beam MB2 : Mean value of the mean of the MT 1 (layer 1 2 3) of all semicells for tracks with less then 45 degrees but with all the four hits in the same semicell . The mean value of the MT of all events gives the same result. HV strip=1800V, Hv I_beam=-1200, Mean MT and Vdrift as a function of HV wire a.meneguzzo , 03 april 2002
d) Dependence of the MT on the angle of the track in the plane normal to the wire. The MT mean value is flat up to around 15 degrees . Up to 25 degrees it decreases of less then 2 %. HV strip=1800V, Hv I_beam=-1200, HV wire =3720 , pressure 1020 mbar a.meneguzzo , 03 april 2002
e No Dependence of the MT on the angle of the track in the plane of the wire. The MT mean value is flat . HV strip=1800V, Hv I_beam=-1200, HV wire =3720 , pressure 1020 mbar a.meneguzzo , 03 april 2002
f Dependence of the MT on the position of the track in the cell of the layer 2. All angles are included ( but 80% of tracks have less then 20 degrees ). Wires are at 0 and +-4.2 cm. MB3_004 SL1 HV strip=1800V, Hv I_beam=-1200, HV wire =3720 , pressure 1020 mbar a.meneguzzo , 03 april 2002