Download
1 / 45
450 likes | 539 Views
From motif search to gene expression analysis. Protein Motifs. Protein motifs are usually 6-20 amino acids long and can be represented as a consensus/profile:. P[ED]XK[RW][RK]X[ED]. or as PWM. Protein Domains. In additional to protein short motifs, proteins are characterized by Domains.

E N D
Protein Motifs Protein motifs are usually 6-20 amino acids long and can be represented as a consensus/profile: P[ED]XK[RW][RK]X[ED] or as PWM
Protein Domains • In additional to protein short motifs, proteins are characterized by Domains. • Domains are long motifs (30-100 aa) and are considered as the building blocks of proteins (evolutionary modules). The zinc-finger domain
Some domains can be found in many proteins with different functions:
….while other domains are only found in proteins with a certain function….. MBD= Methylated DNA Binding Domain
Varieties of protein domains Extending along the length of a protein Occupying a subset of a protein sequence Occurring one or more times Page 228
Pfam • > Database that contains a large collection of multiple sequence alignments of protein domains • Based on • Profile hidden Markov Models (HMMs). • HMM in comparison to PWM is a model • which considers dependencies between the • different columns in the matrix (different residues) and is thus much more powerful!!!! http://pfam.sanger.ac.uk/
Profile HMM (Hidden Markov Model)can accurately represent a MSA D19 D16 D17 D18 100% 16 17 18 19 delete D R T R D R T S S - - S S P T R D R T R D P T S D - - S D - - S D - - S D - - R 100% 50% M16 M17 M18 M19 100% 100% 50% Match D 0.8 S 0.2 P 0.4 R 0.6 R 0.4 S 0.6 T 1.0 I16 I17 I18 I19 insert X X X X
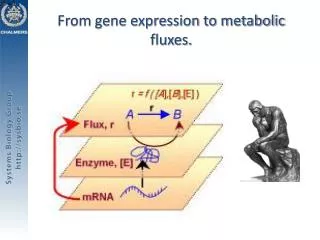
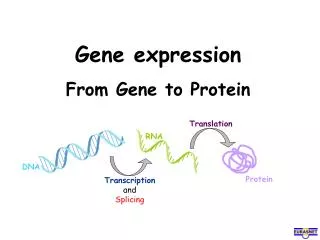
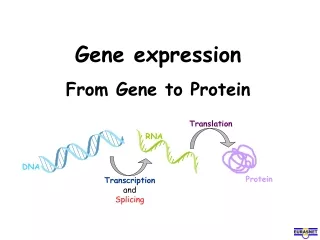
Gene Expression protein RNA DNA
Gene Expression AAAAAAA AAAAAAA AAAAAAA AAAAAAA AAAAAAA AAAAAAA AAAAAAA AAAAAAA AAAAAAA mRNA gene1 AAAAAAA AAAAAAA AAAAAAA AAAAAAA AAAAAAA mRNA gene2 AAAAAAA AAAAAAA AAAAAAA AAAAAAA mRNA gene3
Studying Gene Expression 1987-2011 Spotted microarray (first high throughput gene expression experiments) DNA chips RNA-seq (Next Generation Sequencing)
Classical versus modern technologies to study gene expression • Classical Methods (Spotted microarray, DNA chips) • -Require prior knowledge on the RNA transcript • Good for studying the expression of known genes • New generation RNA sequencing • Do not require prior knowledge • Good for discovering new transcripts
Classical Methods • Spotted Microarray Two channel cDNA microarrays. • DNA Chips One channel microarrays (Affymetrix, Agilent),
Experimental Protocol Two channel cDNA arrays • Design an experiment (probe design) 2. Extract RNA molecules from cell • Label molecules with fluorescent dye • Pour solution onto microarray • Then wash off excess molecules 5. Shine laser light onto array • Scan for presence of fluorescent dye 6. Analyze the microarray image
The ratio of expression is indicated by the intensity of the color Red= HighmRNA abundance in the experiment sample Green= High mRNA abundance in the control sample Cy5 Cy3 Cy5 log2 Cy3 Transforming raw data to ratio of expression Cy3 Cy5
One channel DNA chips • Each sequence is represented by a probe set colored with one fluorescent dye • Target hybridizes to complimentary probes only • The fluorescence intensity is indicative of the expression of the target sequence
NEXT… Clustering genes according to their expression profiles Experiments . Genes
WHY?What can we learn from the clusterers? • Identify gene function • Similar expression can infer similar function • Diagnostics and Therapy • Different genes expression can indicate a disease state • Genes which change expression in a disease can be good candidates for drug targets
HOW?Different clustering approaches • Unsupervised -Hierarchical Clustering -Partition Methods K-means • Supervised Methods -Analysis of variance -Discriminant analysis -Support Vector Machine (SVM)
Clustering Clustering organizes things that are close into groups. - What does it mean for two genes to be close? - Once we know this, how do we define groups?
What does it mean for two genes to be close? We need a mathematical definition of distance between the expression of two genes Gene 1 Gene 2 Gene1= (E11, E12, …, E1N)’ Gene2= (E21, E22, …, E2N)’ • For example distance between gene 1 and 2 • Euclidean distance= Sqrt of Sum of (E1i -E2i)2, i=1,…,N
Once we know this, how do we define groups? • Michael Eisen, 1998 : • Generate a tree based on similarity • (similar to a phylogenetic tree) • Each gene is a leaf on the tree • Distances reflect similarity of expression Hierarchical Clustering Gene Cluster Genes Experiments
Internal nodes • represent different • functional • Groups (A, B, C, D, E) genes • One genes may belong • to more than one cluster
What can we learn from clusters with similar gene expression ??
EXAMPLE- hnRNP A1 and SRp40 HnRNPA1 and SRp40 are not clear homologs based on blast e-value but have a very similar gene expression pattern in different tissues
Are hnRNP A1 and SRp40 functionally homologs ?? hnRNP A1 SF SF SF SF SF SF SF SF SF SF SF SF SRP40 YES!!!!
What can we learn from clusters with similar gene expression ?? • Similar expression between genes • The genes have similar function • One gene controls the other • All genes are controlled by a common regulatory genes
cDNA Microarrays Parallel Gene Expression Analysis Gene-Expression Profiles in Hereditary Breast Cancer • Breast tumors studied: • BRCA1 • BRCA2 • sporadic tumors • Log-ratios measurements of 3226 genes for each tumor after initial data filtering RESEARCH QUESTION Can we distinguish BRCA1 from BRCA2– cancers based solely on their gene expression profiles?
How can microarrays be used as a basis for diagnostic ? 5 Breast Cancer Patient
How can microarrays be used as a basis for diagnostic ? BRCA1 BRCA2 Informative Genes
Specific Examples Cancer Research Hundreds of genes that differentiate between cancer tissues in different stages of the tumor were found. The arrow shows an example of a tumor cells which were not detected correctly by histological or other clinical parameters. Ramaswamy et al, 2003 Nat Genet 33:49-54
Supervised approachesfor predicting gene function based on microarray data Support Vector Machine • SVM would begin with a set of genes that have a common function (red dots), In addition, a separate set of genes that are known not to be members of the functional class (blue dots) are specified.
? • Using this training set, an SVM would learn to differentiate between the members and non-members of a given functional class based on expression data. • Having learned the expression features of the class, the SVM could recognize new genes as members or as non-members of the class based on their expression data.
Using SVMs to diagnose tumors based on expression data Each dot represents a vector of the expression pattern taken from a microarray experiment . For example the expression pattern of all genes from a cancer patients.
? How do SVM’s work with expression data? In this example red dots can be primary tumors and blue are from metastasis stage. The SVM is trained on data which was classified based on histology. After training the SVM we can use it to diagnose the unknown tumor.
Instructions for the final project Introduction to Bioinformatics 2012-13 Key dates 13.12 lists of suggested projects published * *You are highly encouraged to choose a project yourself or find a relevant project which can help in your research 22.1 Submission project overview (one page) -Title -Main question -Major Tools you are planning to use to answer the questions Final week – meetings on projects 12.3 Poster submission 20.3 Poster presentation
2. Planning your research After you havedescribed the main question or questions of your project, you should carefully plan your next steps A. Make sure you understand the problem and read the necessary background to proceed B. formulate your working plan, step by step C. After you have a plan, start from extracting the necessary data and decide on the relevant tools to use at the first step. When running a tool make sure to summarize the results and extract the relevant information you need to answer your question, it is recommended to save the raw data for your records , don't present raw data in your final project. Your initial results should guide you towards your next steps. D. When you feel you explored all tools you can apply to answer your question you should summarize and get to conclusions. Remember NO is also an answer as long as you are sure it is NO. Also remember this is a course project not only a HW exercise. .
Summarizing final project in a poster (in pairs) • Prepare in PPT poster size 90-120 cm • Title of the project • Names and affiliation of the students presenting • The poster should include 5 sections : • Background should include description of your question (can add figure) • Goal and Research Plan: • Describe the main objective and the research plan • Results (main section) : Present your results in 3-4 figures, describe each figure (figure legends) and give a title to each result • Conclusions : summarized in points the conclusions of your project • References : List the references of paper/databases/tools used for your project Examples of posters will be presented in class