Download
1 / 7
70 likes | 216 Views
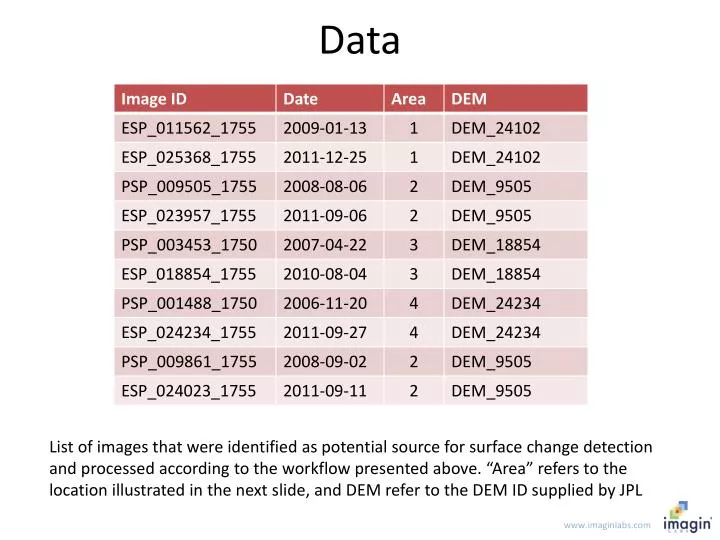
Data. List of images that were identified as potential source for surface change detection and processed according to the workflow presented above. “Area” refers to the location illustrated in the next slide, and DEM refer to the DEM ID supplied by JPL . www.imaginlabs.com. 1. 3.5km. 2. 3.

E N D
Data List of images that were identified as potential source for surface change detection and processed according to the workflow presented above. “Area” refers to the location illustrated in the next slide, and DEM refer to the DEM ID supplied by JPL www.imaginlabs.com
1 3.5km 2 3 Area of interest as indicated by JPL 4
Area 2 Images analyzed: PSP_009505_1755 2008-08-06 ESP_023957_1755 2011-09-06 3 years, 1 month 1 km www.imaginlabs.com
Sand ripples displacement map in the East/West direction (Eastward positive) Sand ripples displacement map in the North/South direction (Northward positive) -2.3 m 0.5 -1.4 m 1.7 All dunes in the area 2 footprint are subject to ripples migration. The direction of the ripple migration is mostly North/South, although strong uncorrected satellite jitter in the East/west direction prevent from measuring the eastward component of the ripples migration. On average ripples migration of 1.5-2 meters in the 3 years, 1 month time frame is observed. www.imaginlabs.com
Area 3 Images analyzed: PSP_003453_1750 2007-04-22 ESP_018854_1755 2010-08-04 3 years, 3 months 1 km www.imaginlabs.com
-2.7 m 0.5 -2.5 m 1.0 Sand ripples displacement map in the East/West direction (Eastward positive) Sand ripples displacement map in the North/South direction (Northward positive) All dunes are subject to ripples migration; migration amplitude of more than 2 meters in the 3 years, 3 months time frame is observed on several dunes. www.imaginlabs.com
Orientation of the ripples migration over the 3 years, 3 months period Orientation is in accordance with dune shape and evolves from a South direction to a South-East direction the further we go south on the dune field www.imaginlabs.com