Download
1 / 15
150 likes | 243 Views
Measuring the Benefits of Improved Market Access. Irina Orlova CASE Ukraine January 2008. Contents. Introduction Research structure Quantifying NTBs CGE modeling Economy-wide impacts of improved market access. Introduction.

E N D
Measuring the Benefits of Improved Market Access Irina Orlova CASE Ukraine January 2008
Contents • Introduction • Research structure • Quantifying NTBs • CGE modeling • Economy-wide impacts of improved market access
Introduction • The aim of this study is (through modeling exercise) to identify economic impacts of institutional harmonization between ENP5 countries and the EU. • CGE model is used; reduction of NTBs to trade is the key assumption in institutional harmonization scenarios. • ENP5 (European Neighborhood Policy) include countries: Armenia, Azerbaijan, Georgia, Russia, and Ukraine.
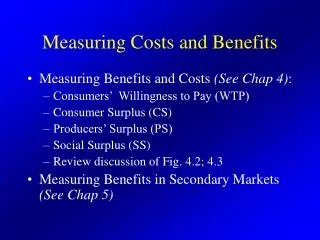
Structure of research • Quantifying current level of NTBs to trade in goods and services for a benchmark country • Adjusting benchmark assumptions for other countries of our interest • Simulating economy-wide impacts
Assumptions on NTBs (1) In the context of institutional harmonization removal of NTBs is the key element to the improved market access. Therefore, quantifying the magnitude of NTBs is very important in estimating the effects of improved market access. We estimate the level of NTBs based on previous business surveys, conducted for Ukraine.
Assumptions on NTBs (2) • Ukraine: a benchmark. • We base our assumptions on two studies done for Ukraine and three for Russia: • Business survey of Ukrainian exporters to the EU, conducted by CASE and CASE UA in 2006. • Project “Analysis of the economic impacts of Ukraine’s accession to the WTO”, done by Copenhagen Economics, Institute for Economic Research and Policy Consulting, and Institute for East European Studies Munich (2005). • Three WB background papers by Kimura et al (2004) estimating the ad valorem equivalent of barriers to FDI.
Assumptions on NTBs (3) • Types of NTBs included in our modeling: • Standards and technical regulations (product certification requirements, testing procedures, labeling standards, etc.) • Border costs (customs and administrative procedures) • Barriers to trade in services (discriminatory measures faced by foreign service providers with regard to their statutory funds, supply of particular services, establishing branches, etc.)
Assumptions on NTBs. Standard costs (1) • To develop assumptions on the current level of standard costs in ENP5 we take Ukrainian estimations as a benchmark and adjust them for other ENP in line with: • Level of harmonization of national legislation, technical regulations and standards with the EU • Status of WTO accession/membership (level of implementation of WTO commitments) • Availability of quality assurance infrastructure (certification bodies, etc.) • Formal EU policy towards particular products from CIS
Assumptions on NTBs. Standard costs (2) Assumptions on standard costs as percentage of annual production costs spent by exporters to the EU to comply with the EU norms, 2006
Assumptions on NTBs. Standard costs (3) Percentage of annual production costs spent by exporters to the EU to comply with the EU norms, 2006 Source: own assumptions based on business survey , conducted in 2006
Assumptions on NTBs. Border costs (1) • Assumptions on level of border costs are also based on CASE business survey (2006), which provides the costs of customs clearance faced by Ukrainian exporters to the EU • To develop assumptions for other ENP countries we use The Doing Business WB reports, which allow for comparison of border costs across countries and over time. Assumptions on border costs in 2006 as percentage of export value Source: own assumptions based on business survey , conducted in 2006 and Doing Business World Bank reports
Assumptions on NTBs. Barriers to trade in services (1) Barriers to trade in services for Russia were most recently estimated by Kimura et al (2004) and for Ukraine - by Copenhagen Economics, IER, IEESM (2005) To develop assumptions on barriers to FDI in services for Georgia, Armenia, and Azerbaijan we use Ukraine’s estimates from the above-mentioned study. Ukraine’s estimates are adjusted for each country taking into account: (1) WTO accession/membership status; (2) Heritage Foundation economic freedom indices (global economic freedom covers 10 freedoms including investment freedom index and financial freedom index)
Assumptions on NTBs. Barriers to trade in services (2) Assumptions on barriers to trade in services (ad-valorem tariff equivalents), 2006 Source: Kimura et al (2004), Copenhagen Economics (2005), own assumptions
Modeling • We employ a standard static computable general equilibrium model • Main data originates from GTAP7 prelease 3 database • Three simulation scenarios: trade liberalization (2004-2006), Simple FTA, and Deep FTA • Focus on Deep FTA – assumption of 50% reduction for all NTBs
Results of Deep FTA simulations All ENP5 will benefit: • Welfare gains: Ukraine (5.8%), Armenia (3.1%), Azerbaijan (2.9%), Russia (2.8%), Georgia (1.7%) • Impact on wages of skilled workers: Ukraine (4.7%), Azerbaijan (3.8%), Russia (2.5%), Armenia (2.4%), Georgia (1.5%) • Impact on wages of unskilled workers: Ukraine (6.4%), Azerbaijan (4.9%), Armenia (3.7%), Russia (3.1%), Georgia (2.0%) • Total exports: Georgia (22.9%), Armenia (21.2%), Russia (20.0%), Ukraine (13.7%), Azerbaijan (13.3%)