Download
1 / 23
230 likes | 322 Views
It’s easy! Kind of:. Using Function Points. Steve Chenoweth, RHIT. Remember function points?. Another way to consider “opportunities for error” (OPEs). Uses a weighted total of 5 major components: Number of external inputs x 4 Number of external outputs x 5 Number of internal files x 10

E N D
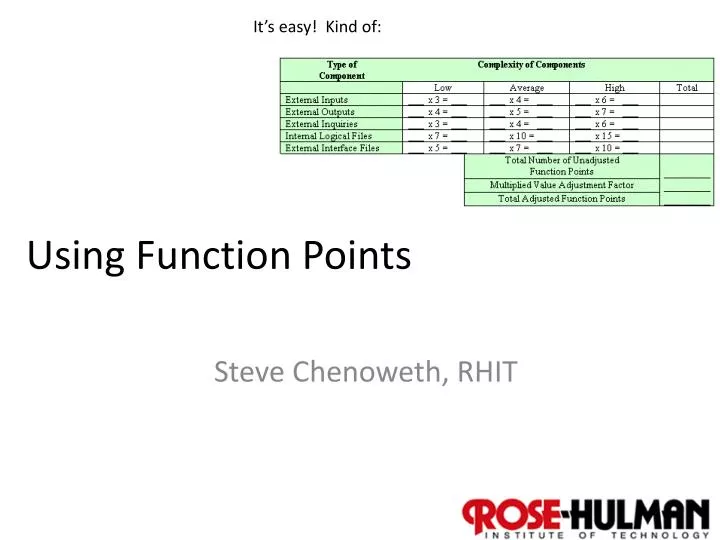
It’s easy! Kind of: Using Function Points Steve Chenoweth, RHIT
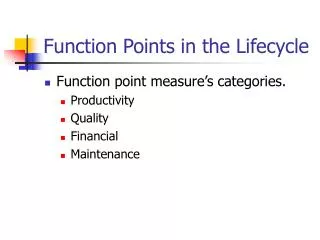
Remember function points? • Another way to consider “opportunities for error” (OPEs). • Uses a weighted total of 5 major components: • Number of external inputs x 4 • Number of external outputs x 5 • Number of internal files x 10 • Number of external interface files x 7 • Number of external inquiries x 4 These are the “average weighted factors”…
We skipped over the rest of the steps! • There are low and high weighting factors for these, depending on an expert’s “complexity assessment,” like: • External input: low complexity, 3; high complexity, 6 • External output: low complexity, 4; high complexity, 7 • Based on standards, like, for the latter, • If the number of data element types is 20 or more and the number of file types referenced is 2 or more, then complexity is high. • If the number of data element types is 5 or fewer and the number of file types referenced is 2 or 3, then complexity is low.
So, • FCs (Function Counts) are the sum of all these. • Then, there’s a scale from 0 – 5 “to assess the impact of 14 general system characteristics in terms of their likely effect on the application.” These characteristics are: • Data communications • Distributed functions • Performance • Heavily used configuration • Transaction rate • Online data entry • End-user-efficiency Online update Complex processing Reusability Installation ease Operational ease Multiple sites Facilitation of change
Getting there, at last: • Where ciis the score for the general system characteristic i. • And… (wait for it) • FP = FC x VAF, • Where FP are the function points.
Issues • Mainly, having multiplied terms like this leaves a lot of room for slight differences in judgment to be multiplied, too. • The sensitivity suggests some formal training and experience help make the results reliable. • Using LOC had a head start on FP’s. • Meaning isn’t based on a deep theory. • Many variations in how it’s used. • Takes a lot of work to get FP’s, vs LOC.
On the other hand, • FP’s appear to be a slightly better measure than LOC. • They can be used on documents, before you code, to guess defect rates. • There’s not enough theory and empirical evidence (yet) to back up any process improvement methods in the definitive ways we would like.
Key questions about improvement • What does it cost to improve software processes? • How long does it take to see tangible improvements, if processes do improve? • What kind of value results from process improvements? • Fewer failures • Higher productivity and quality? • Shorter schedules? • Higher user satisfaction? • Fewer lawsuits for breach of contract?
Kan recommends an improvement sequence • Stage 0: Software process assessment, baseline and benchmark. • Stage 1: Focus on management techniques. • Stage 2: Focus on software processes and methodologies. • Stage 3: Focus on new tools and approaches. • Stage 4: Focus on infrastructure and specialization. • Stage 5: Focus on reusability. • Stage 6: Focus on industry leadership.
Stage 0: Baseline • Doesn’t improve anything • Sets you up for being able to measure improvements. • Do a formal process assessment. • Establish a quantitative baseline of current productivity and quality levels. • Here’s where you start counting FP’s. • Perhaps done to measure against similar companies in the same industry. • Outside consulting companies – readily available. • Including Kan’s – SPR.
Stage 1: Focus on Management • Bring the managers up to speed on: • Planning • Sizing • Cost estimating • Milestone tracking • Quality and productivity measurement • Risk analysis • Value analysis • They have to calculate ROI later. • They also have to collect data to demonstrate progress.
Stage 2: Software processes and methodologies • Do before buying tools! • They support processes, rather than the other way around. • New processes can be deployed: • Joint application development • UML • Inspections • Change management
What’s JAD? • See http://www.umsl.edu/~sauterv/analysis/488_f01_papers/rottman.htm. • Like a customer focus group, but for design. • Stakeholders reach a consensus. • Like a predecessor to the XP idea of keeping a customer in the loop as you develop. • Goes with the “V & V Vee”
Stage 3: New tools and approaches • Pick your weapons! • Configuration management • Complexity analysis tools • Test case monitors • Analysis and design tools • New development environments • Also, time to “convert” to things people have been avoiding, like OO frameworks. • Need to spend on training! • The half-hearted will revert.
Stage 4: Infrastructure and specialization • Specialized teams for handling critical activities • Specialists outperform generalists • Testing • Maintenance • Integration • Configuration control • Technical writing • QA • Better organizational structures
Stage 5: Reusability • Has the best return on investment. • Surprised? • Effective reuse is difficult. • Includes reuse of errors! • Reusable components can be other than code: • Requirements • Designs and specs • User documents • Test plans, test cases and scripts
Step 6: Industry leadership at last • Goal: Outperform competitors in development and maintenance. • Typical signs of success: • Effective project management tool suites • Effective software development tool suites • Effective quality assurance and testing tool suites • Effective software processes and methods • Effective organizational structures • Effective technical teams with substantial specialization … and
Step 6, cntd • More signs: • High morale among the software staff • High user satisfaction levels • High regard by top corporate management • High regard by industry analysts • High regard by competitive organizations
Process improvement economics = ½ person-month “Per capita” = “per seat” for tools and training.
More economics = 5 years Here we see the slowness of cultural changes, even under almost ideal conditions.
And some more Translation to $ or time?
Measuring process improvement • Have to look at specific activities of projects.
Overall differences This is the SEI selling story for their SCAMPI assessment process.