Download
1 / 65
710 likes | 1k Views
Thermal Infrared Remote Sensing Lecture 7. Summer Session 04 August 2011. AVHRR Image of land and sea surface temperature from thermal IR radiance measurements Red – warmest Orange Yellow Green Blue Purple - coldest. Image from http ://rs.gso.uri.edu/amy/avhrr.html.

E N D
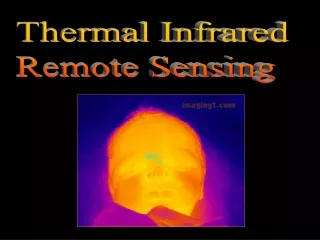
Thermal Infrared Remote SensingLecture 7 Summer Session 04 August 2011
AVHRR Image of land and sea surface temperature from thermal IR radiance measurements Red – warmest Orange Yellow Green Blue Purple - coldest Image from http://rs.gso.uri.edu/amy/avhrr.html
MODIS Active Fire Detection Products are based on information recorded in the Thermal IR channels MODIS 3.9 microns ‘fire’ bands are highly sensitive to thermal emissions at usual fire temperatures (Giglio et al. 2005).
The electromagnetic (EM) spectrum Thermal IR Region longer wavelength shorter wavelength
Issues in Thermal IR Remote Sensing • How are the signature(s) detected by thermal IR systems generated? • What are the sources of the radiance detected by thermal IR systems, particularly atmospheric effects? • What satellite thermal IR systems are available? • How is information generated using data collected by thermal IR systems?
Thermal IR Radiometer Signature Detected by a Thermal Radiometer Ls Lp Lt Ma emitted energy from the atmosphere Mt– emitted energy Target
Sources of surface temperature variations – temperature gain and loss • Absorbed short-wavelength EM energy (from energy emitted from the sun) (temperature gain) • Long-wavelength EM energy emitted from the earth’s surface (temperature loss) • Combustion processes • Geothermal processes
Stefan-Boltzman Law • The amount of EM radiation (M) emitted from a body in Watts m-2 (the exitance) can be calculated as M = T4 where is a constant and T4 is the temperature in degrees Kelvin
Wien Displacement Law • The wavelength with the highest level of emitted radiation (max) for an object of temperature T can be calculated as max = k / T where k = 2898 m ºK
Examples of Wien’s Displacement Law • T (sun) = 6000º K max = k / T = 2898/6000 = 0.483 m T (earth) = 300º K max = k / T = 2898/300 = 9.66 m
Kinetic Heat - Tkin • Kinetic heat is the energy of particles of molecular matter in random motion • aka “internal” “real” or “true” heat • When particles collide, they change their energy state and emit electromagnetic radiation • Wien, Stefan-Boltzman, Planck… • Tkinis the true kinetic temperature, measured with a thermometer in situ
Radiant Temperature - Trad • An object’s internal kinetic heat is also converted to radiant energy(aka “external” or “apparent” energy) • Tradis simply the radiant flux being emitted by an object because of its temperature, i.e. the radiant temperature • Tradin the real world is always less thanTkin • However, in most materials they are closely related, which is why we can use a radiometer to measure temperature! • Trad= Tkinonly if the object is a blackbody!
Blackbody A theoretical object or surface that • Absorbs all the radiation that falls upon it • Radiates energy at the maximum rate possible at all wavelengths • This would mean the true internal kinetic heat would equal the radiant temperature
Emissivity - Emissivity defines the amount of radiation emitted from a body or surface (Mr) relative to the exitance of a blackbody (Mb) at the same temperature = Mr / Mb
Factors influencing emissivity • Color • darker colors are better absorbers/emitters • Surface roughness • as surface roughness increases, absorption/emission increases • Moisture content • as moisture increases, absorption/emission increases • Compaction • absorption/emission is proportional to material density • EM wavelength • absorption/emission vary as a function of wavelength • Viewing angle • absorption/emission vary as a function of viewing angle
Graybody and Selective Emitters • Graybody emitters are those whose emittance is less than a black body with the same temperature, but whose emissions are a constant as a function of wavelength • Selective emitters are bodies whose emittance is less than a black body with the same temperature, but not constant as a function of wavelength
These materials are all selective emitters Almost a graybody but not quite
Kirchoff’s Radiation Law For any object that intercepts EM radiant energy r + + = 1 at thermal IR wavelengths, Kirchoff determined that = 0 and = Therefore 1 = r + GOOD ABSORBERS ARE GOOD EMITTERS GOOD REFLECTORS ARE POOR EMITTERS
Table 8-1 Emissivities of natural materials
Non-Blackbody Exitance (1) Then, if a surface or body has an emissivity of , then its emittance, Mr, is Mr = * Tkin4 where • is the Stephan-Boltzman constant Tkin is the kinetic temperature Since emissivity of an object is related to its exitanceby: = Mr / Mb And blackbody (Mb) radiators follow: Mb= T4 See pp. 258-259 for more information
Non-Blackbody Exitance (2) • The radiant temperature being recorded by a remote sensor is related to its true kinetic temperature and emissivity by: Trad= (1/4) * Tkin See pp. 258-259 for more information
Thermal IR Radiometer Sources of Signatures Detected by a Thermal Radiometer Ls Eo Lt • t-sw - absorption coefficient for shortwave EM radiation To – transmission coefficient Eo– path radiance Mt– emitted energy Target t-sw, Tkin,
Importance of albedo in thermal IR remote sensing • On the land and ocean surface, the sun provides most of the energy that results in variations in surface temperature • Albedo is the fraction of incoming solar radiation (0.3-2.4 microns) that is reflected from the earth’s surface in all directions. • Surfaces with high albedo absorb little solar energy and therefore tend to have little thermal IR variability • Surfaces with low albedo absorb much energy, and have the potential for high thermal IR variability
Most of the thermal IR energy emitted by the earth’s surface is absorbed by CO2, CH4, H20, O3 a-lw Only three windows where any longer wavelength thermal IR radiation gets out
Thermal IR Radiometer Signature Detected by a Thermal Radiometer Ls Lp Lt Ma emitted energy from the atmosphere Mt– emitted energy from the target Target
Thermal IR Radiometer Thermal IR Radiometer Signature Detected by a Thermal Radiometer Path Radiance Ls Lp Ma a-sw + a-lw Tempa Reflected thermal IR energy Target
Spaceborne Thermal IR Radiometers • Landsat • AVHRR • MODIS • ASTER
Landsat Thermal IR Channel Atmospheric Windows For Thermal IR Scanners
At 0 C (272 K), max = 10.65 um At 25 C, max = 9.76 um At 50 C, max = 9.00 um AVHRR Thermal IR Channels 4, 5 AVHRR Thermal IR Channel 3 Atmospheric Windows For Thermal IR Scanners
These bands can be used to estimate the amount of water vapor in the atmosphere MODIS Bands 27-29 located in water absorption region of EM spectrum MODIS Band 30 located in Ozone absorption region of EM spectrum
MODIS bands 33-36 are in the 13.2 to 14.5 um range, i.e, in region where there is strong atmospheric absorption However, these bands are used to estimate cloud top height, based on the fact that atmospheric temperature varies as a function of height in a known matter Many cloud tops are > 10,000 m in height, and therefore above that part of the atmosphere where most absorption occurs – so… the atmospheric window in this diagram does not apply to these bands
Advanced Spaceborne Thermal Emission and Reflectance Radiometer (ASTER) • ASTER was launched in December, 1999 • Jointly developed by U.S. and Japanese • 3 channels in the visible/near IR (reflectance) • 6 channels in the shortwave IR (reflectance) • 5 channels in the thermal IR (emittance) • Developed to discriminate different rock types (minerology)
ASTER Differs from other Thermal IR sensors because it has three channels in the 8 to 9 umrange in addition to two channels in the 10 to 12 um range
ASTER has (had) 6 channels in the shortwave IR region between 1.5 and 2.4 um ASTER Landsat http://www.ghcc.msfc.nasa.gov/precisionag/atlasremote.html
Emittance spectra of different minerals From: http://www.gps.caltech.edu/~ge151/ tutorials/tut_2.shtml Between 8 and 11µm where Aster operates (red lines), the emittance of minerals varies considerably. Aster was originally designed for mineralogy and geological purposes
ASTER Image (Visible) Red = B3 (.76-.86 um) Green = B2 (.63-.69 um) Blue = B1 (.52 -.59 um) Saline Valley area of California, collected in March 2000 NASA/GSFC/MITI/ERSDAC/ JAROS, and U.S./Japan ASTER ScienceTeam
ASTER Image (SWIR) Red = B4 (1.6 – 1.7 um) Green = B6 (2.19 – 2.23 um) Blue = B8 (2.30 – 2.37 um) In this case, color relates to minerology: absorption features of clay, sulfate and carbonate minerals result in distinct colors -limestones are yellow/green -Purple areas are kaolonite rich NASA/GSFC/MITI/ERSDAC/JAROS, and U.S./Japan ASTER Science Team
ASTER Image (Thermal IR) Red = B13 (10.3-11.0 um) Green = B12 (8.9-9.3 um) Blue = B10 (8.1-8.5 um) Quartz rocks = red Carbonate rocks = green Volcanic rocks = purple NASA/GSFC/MITI/ERSDAC/JAROS, and U.S./Japan ASTER ScienceTeam http://asterweb.jpl.nasa.gov/gallery/gallery. htm?name=Saline
Forward-Looking Infrared (FLIR) Systems • Infrared detection technology has been exploited to create scanning systems that can be used for local surveillance purposes • FLIR systems use an linear array of detectors that enable creating an image with a single scan or sweep of an area • Use an oblique viewing direction to scan areas being monitored
FLIR Images Provide an image of an area at night without using any source of illumination Can be used to monitor remote areas or sites, the same as a video camera Are very popular in Law enforcement systems Also used in fire monitoring and operations, can see hotspots and fire locations even through smoke Used in search and rescue operations
Advances in Thermal IR sensor technology have led to development of smaller and smaller systems Monitoring levels in an acid storage tank Detection of malfunctioning electrical transformer
Sources of temperture variation on the Earth’s surface • The Sun - the ultimate source of many of temperature variations on the earth surface • Atmosphere is an additional source of temperature variations. • Diurnal and seasonal cycles of temperature changes • Thermal capacity – the amount of energy required to raise one gram of the material by one degree C
Thermal IR Radiometer Throughout the day and throughout the growing season, the amount of sunlight reaching the earth’s surface is not constant Ls Lt • a-lw - absorption coefficient for longwave EM radiation Mt– emitted energy Target t-sw, Tkin,