Download
1 / 28
280 likes | 379 Views
Recent Developments in the Electricity Market that Affect the New Build Business Cycle. MIT Monday Seminar Series May 7, 2007. Outline. Background on Electricity Markets Analytics and Decision Making Spark Option Model Electricity trading linked with corporate policy External Factors

E N D
Recent Developments in the Electricity Market that Affect the New Build Business Cycle MIT Monday Seminar Series May 7, 2007
Outline • Background on Electricity Markets • Analytics and Decision Making • Spark Option Model • Electricity trading linked with corporate policy • External Factors • Market Design • Regulatory Landscape • Market Conditions • Industry Participants
Background • Different price in each time period (hourly granularity – 5 minutes in some markets) - based on weather, fuel price, available generation, transmission constraints, etc. • Different price by location (node or zone) based on weather, fuel price, transmission constraints, local demand, etc. • Volatile commodity - electricity is not a storable • Any 5 minute interval can have a price 20x to 60x annual average price levels
Background • Financial commodity created to mimic physical system requirements • Independent System Operator (ISO) is responsible for procuring services, balancing energy and demand, transmission security and trade enforcement • Forward Markets • Energy • Capacity • Daily/Hourly Markets • Energy Imbalance (Frequency) • Regulation Up/Down • Spinning Reserve • Nonspinning Reserve • Voltage Stability • Black Start
Decision Making Processes • Background on Electricity Markets • Analytics and Decision Making • Spark Option Model • Electricity trading linked with corporate policy • External Factors • Market Design • Regulatory Landscape • Market Conditions • Industry Participants
Black - Scholes equation Assumes price moves as geometric Brownian motions Option value=f(average price, price volatility, interest rate, strike price, time to maturity) Challenges: tails risk, liquidity, transaction costs, lognormality P&L Option Payoff Option Premium Underlying Power $ Probability Strike Price Lognormal Distribution Underlying Power $ Strike Price Option Value + = 0
Market Implied Heat Rate (MIHR) Methodology • Old Methodology • Simulate Power prices traditional method (lognormal) • Match Power price uncertainty implied in the market • Simulate Gas Price • Match Gas price uncertainty implied in the market • Correlate Gas Price and Power Price Uncertainty • Determine Heat Rate Option Value • New Methodology • Simulate gas price fundamental method (Temperature > Demand > Price) • Match Power price uncertainty implied in the market • Simulate MIHR (using generation stack fundamentals) • Calculate Power Price • Match Power price mean and price uncertainty implied in the market • Determine Heat Rate Option Value
Probability Probability Unit On Unit Off Unit On Unit Off Unit Heat Rate High Correlation High Correlation Unit Heat Rate Low Correlation Low Correlation Market Implied Heat Rate Market Implied Heat Rate Spread Option: Impact on Results General Relationships As Correlation Increases, the range of Market Implied Heat Rate decreases For MIHR > Unit Heat Rate unit turns on and makes money For MIHR < Unit Heat Rate unit turns off and avoids loss of money For an Out of the Money Spread Option (peaker) As correlation increases Value Decreases Expected Dispatch Decreases For an in the money Spread Option (combined cycle) As correlation increases Value Decreases Expected Dispatch Increases Out of the Money Spread Option In the Money Spread Option
PJM Dispatch Stack PJM Classic July 2005 Stack 160 Delivered Gas: $6.44/MMBtu 150 #2 HOil: $6.89/MMBtu Jul 2005 Min Load Jul 2005 Avg Load Jul 2005 Peak Load #6 Oil: $4.96/MMBtu 140 Peakers 130 120 110 100 #6 Oil 90 CCGT 80 Optg. Cost ($/MWh) Hydro Pump 70 Winds 60 50 Coal PJM July 2005 40 Generation Units Nukes Annual Peak Load 30 Annual Avg. Load 20 Minimum Load Hydro 10 Must Run Blocks 0 0 5,000 10,000 15,000 20,000 25,000 30,000 35,000 40,000 45,000 50,000 55,000 60,000 65,000 70,000 Inclusion of the fundamental stochastic stack results in a more appropriate value assessment Cumu. Cap (MW)
Example Results: Capacity Factor CCGT Onpeak: Spark Spread vs Capacity Factor History vs Spark Spread Option(Old) vs MIHR Method (New) Modeled dispatch compared to historical results more appropriate using MIHR method
Regulatory Marketing & Business Development Mid Marketing OTC Trading Next Day Current Day Gen Dispatch Alignment of Decision Processes • Generation Mix • Demand Obligations • Regional Power Portfolio • Fuels Portfolio DecreasingTime to Delivery • Corporate Strategy • Long-term Transactions (Structuring and Pricing) • Financial Planning • Portfolio Management • Capital Expenditure • Risk Analysis
Portfolio Monitoring Example • Detailed views of the position at spot: by day type (as designated by price range an example position statement provides insight into products that can be used to hedge (for example call options, put options, … Fundamentals based stochastic analysis feeds everyday position monitoring decisions as well as optimization results that consider the range of potential opportunities
Financial Risks Medium Low High Low Higher Hedging Higher Financial Flexibility Lower Debt / Capital Lower Dividends Higher Hedging Lower Financial Flexibility Higher Debt / Capital Higher Dividends Market Risk Medium Lower Hedging Higher Financial Flexibility Lower Debt / Capital Lower Dividends Lower Hedging Lower Financial Flexibility Higher Debt / Capital Higher Dividends High Alignment of Corporate Strategy with Transactional Strategy • Analysis suggests that most commodity companies: • Strive to balance financial and market risk • If the company has high debt compared to equity, then they manage the market risk through transactions, geographic and cross-commodity diversification • Companies that are willing to take greater market risk (i.e., less transactions), generally maintain substantial B/S strength and have meaningful structural diversification • Align their management policies in a way that allows them to weather low points of commodity cycles, and for some, take advantage of the down cycles to create a positive growth trajectory Strategic participants have three potential levers for managing financial risk: • Capital structure • Dividend policy • Ability to adjust spending For managing market risk • Transactional hedging for the near term • Structural hedging for the long term
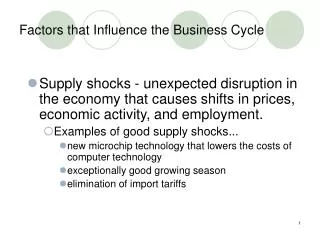
Market Participants Market Structure Capacity Auctions (PJM and ISO-NE) Energy Only (ERCOT) Environmental Regulation Cost of New Build Nuclear Specific 2005 Energy Bill Uranium Prices External Factors affecting Business Cycle
Market Participants • Traditional/Strategic • Electric Utilities/ Gencos • Independent Power Producers (Tenaska, Calpine) • Financial • Hedge Funds (Citadel, Amaranth, Enchanted Rock) • Private Equity (KKR, TPG, . . . ) • Banks (GS, MS, ML, Lehman, CSFB, Barclays, . . .)
Electric Power Market – RTO Regions MISO ISO-NE NYISO SPP PJM CA ISO ERCOT
ISO Operated Power Market - PJM Generation Breakdown April 2007 Results for PY2007 (6/07-5/08) Recent auction results support a new build generation in only the most constrained and difficult to build capacity zones
ISO Operated Power Market - NEISO Generation Breakdown Transition Period December 2006 – May 2010: Capacity $ is $36-48/kw-yr PY 2010 Capacity Auction (June ‘10–May ‘11) held February 2008 – 28 months forward
ISO Operated Power Market - ERCOT North West South Houston Generation Breakdown No planned capacity market or forward capacity auction. Use an “Energy Only” construct to incent new generation. Challenges to short term bidding behavior that include all costs conflict with incentive to build new generation
PJM Dispatch Stack: Bidding Behavior PJM Classic July 2005 Stack 160 Delivered Gas: $6.44/MMBtu 150 #2 HOil: $6.89/MMBtu Jul 2005 Min Load Jul 2005 Avg Load Jul 2005 Peak Load #6 Oil: $4.96/MMBtu 140 Peakers 130 120 110 100 #6 Oil 90 CCGT 80 Optg. Cost ($/MWh) Hydro Pump 70 Winds 60 50 Coal PJM July 2005 40 Generation Units Nukes Annual Peak Load 30 Annual Avg. Load 20 Minimum Load Hydro 10 Must Run Blocks 0 0 5,000 10,000 15,000 20,000 25,000 30,000 35,000 40,000 45,000 50,000 55,000 60,000 65,000 70,000 Cumu. Cap (MW) In an “Energy Only” market what components of fixed costs are valid to include in bidding behavior
Key federal regulations - Background • Regulations on SO2, NOX, and Hg are getting more stringent and expensive starting in 2009: • In 2009, an annual NOX control program is added to the ozone season NOX SIP Call. • In 2010, eastern states will need to surrender 2 allowances for 1 ton of SO2 emissions • In 2010, the first Hg cap will become binding • In 2015 eastern states owe 2.86 allowances for 1 ton of SO2 emissions, and federal Hg cap tightens. • Many states are requiring tighter and more expensive unit-level Hg controls. • Federal regulations are the minimum requirements. States are going past federal requirements. • The less flexible design a state regulation has, or the lower the target emission rate of the program is, the more difficult and expensive compliance becomes for generating units
Key state regulations - Background • Units in some states face tougher regulations than the federal Clean Air Interstate Rule (CAIR) which begins new or tougher regulations on NOX and SO2. • MD and DE have imposed more aggressive emission reductions on electric generating units (EGUs) • In Texas, DFW and Houston/Galveston have established tight NOX programs to come into compliance with federal standards on ground-level ozone. • Northeast Ozone Transport Commission (OTC) “High Electric Demand Day - HEDD” strategy. States will develop plans to cut NOX emissions on peak days • Mercury: At least 18 other states are going beyond the Clean Air Mercury Rule (CAMR) to unit level Maximum Achievable Control Technology (MACT) regulations: • PA Regulations • Phase I 2010-2014: Emission Cap and 80% reduction or 0.024 lb/GWh • Phase II 2015+: Emission Cap and 90% reduction or 0.012 lb/GWh • Compliance: unit by unit, facility wide emission averaging, or system wide. No trading • IL Regulations • 90% removal by 2009. No trading • Ameren, Dynegy, Midwest Generation agreed to multi-pollutant agreements (NOx, SO2, Hg) • Carbon Dioxide (CO2). States beginning to act unilaterally and as regions: • RGGI. 10 northeast states in Regional Greenhouse Gas Initiative. CO2 cap and trade program for EGUs. 2009-2014 stabilize CO2 at current levels. 2015 to 2019 phase in 10% reduction from current levels. Limited use of emission offsets allowed (CT, DE, MA, ME, NH, NJ, NY, RI, VT; MD) • California passed legislation in 2006: AB 32 sets statewide GHG cap (1990 levels by 2020, industry start date of 2012). SB 1368 requires CO2 performance standard for long-term power contracts (CPUC has set interim standard of 1,100 lb/MWh – roughly equal to a combined cycle emission rate). Increasing environmental costs will favor nuclear and renewable construction over fossil fuels
History of Nuclear Fuel Market Uranium fuel price has increased by >100% over the last year. April 17th, 2007 market at 120/180 for uranium.
Uranium Supply vs. Demand View of Supply and Timing of Supply will affect assessment of market price
PJM Dispatch Stack: Next Best Alternative PJM Classic July 2005 Stack 160 Delivered Gas: $6.44/MMBtu 150 #2 HOil: $6.89/MMBtu Jul 2005 Min Load Jul 2005 Avg Load Jul 2005 Peak Load #6 Oil: $4.96/MMBtu 140 Peakers 130 120 110 100 #6 Oil 90 CCGT 80 Optg. Cost ($/MWh) Hydro Pump 70 Winds 60 50 Coal PJM July 2005 40 Generation Units Nukes Annual Peak Load 30 Annual Avg. Load 20 Minimum Load Hydro 10 Must Run Blocks 0 0 5,000 10,000 15,000 20,000 25,000 30,000 35,000 40,000 45,000 50,000 55,000 60,000 65,000 70,000 As uranium becomes more of a commodity, the upper bound on price comes from coal which current all in costs are a factor of 3 greater than nuclear Cumu. Cap (MW)
2005 Energy Policy Act • Federal Loan Guarantee • For 80/20 debt equity approximately 70% of the required cash flow • For an increase of project cost by 50% - about 80% of the required cash flow (increasing the required ATC price from $48 to $65) • Production Tax Credits The election of a Democratic Congress raises questions on whether the key provisions supporting nuclear generation new build will be appropriated
Conclusions • Most baseload generation will be built in regulated markets • Baseload nuclear generation in unregulated markets will be handicapped given increased costs of build and increased costs of fuel • The fuel mix in unregulated markets will continue to increase in the % of gas supply for these regions • Peaking and midmerit generation will be built to meet demand with less of a boom/bust cycle than the ’99-’00 timeframe