Download
1 / 16
180 likes | 620 Views
CPI and Inflation. The Consumer Price Index and Measurement of Inflation. A Price Index. A price index is used to show changes in prices over a period of time. A simple price index measures the change in the price of one product only.

E N D
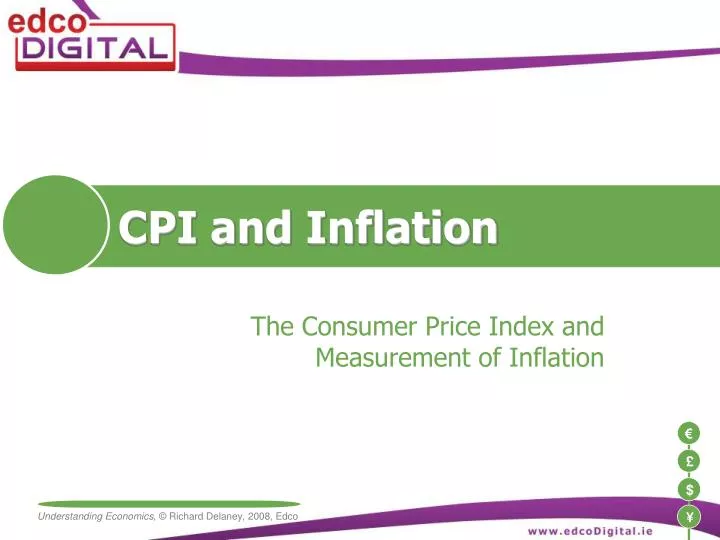
CPI and Inflation The Consumer Price Index and Measurement of Inflation
A Price Index • A price index is used to show changes in prices over a period of time. • A simple price index measures the change in the price of one product only. • A composite index measures the change in price of a number of goods together. • The consumer price index is an index drawn up by the CSO to measure the changes in the general level of prices over a period of time.
The Harmonised Index of Consumer Prices • Abbreviated to HICP. • This is the measurement of price changes calculated by each member state of the European Union based on a harmonisation and standardisation of practices within the EU. • The purpose of the HICP is to allow for the comparison of different consumer price trends in the different member states.
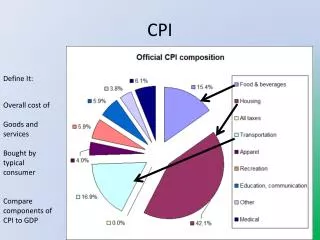
Consumer Price Index • The national average household shopping basket. • The fraction of income that the average household spends on each item. • The price of each item. Every 5 years a household budget survey is conducted to establish:
Procedure for Drawing Up the CPI • A base year is chosen. • The prices of the goods in the basket are checked every quarter. • A simple index is made for each product using the price in the base year as 100. • Multiply the index for each product by its weighting. • Add the results to establish the CPI for each year.
Constructing a CPI The following prices are established for three products for the four year period 2004–2007. It is also established that 50% of income is spent on “A” and 25% each on “ B” and “C”.
Constructing a CPI A B C CPI 2004 100 100 100 50% 25% 25% 50 + 25 + 25 = 100 2005 120 125 150 50% 25% 25% 60 + 31.25 + 37.5 = 128.75 2006 125 135 175 50% 25% 25% 62.5 + 33.75 + 43.75 = 140 2007 140 140 200 50% 25% 25% 70 + 35 + 50 = 155
Use of / Importance of CPI Statistics • Used to measure the official rate of inflation. • Used as the basis for claims for wages and social welfare benefits increases. • Used as one of the economic indicators. • Used to compare our price competitiveness on the international market. • Traditionally it was used as a basis for indexation of interest rates.
Limitations of the CPI • It uses a limited range of products – about 8,000 products only are included. • It does not include new products that have come on the market since the household survey was conducted. • It overstates the cost of living as people switch to cheaper substitutes when prices increase. • The survey establishes the basket of goods of the “average” household. There is no such thing as the average household as “ the average” is a mathematical concept. • It takes no account of changes in the quality of goods. • It makes no allowance for differences in rural and urban lifestyles. • It makes no allowance for price increases due to increased indirect taxes, which are used to provide extra services.
Constant Tax Price Index (CTPI) A CTPI is one that ignores price increases due to increases in indirect taxes. Argument for CTPI Governments claim that extra services are given for these taxes. Argument against CTP Not all people benefit from these services.
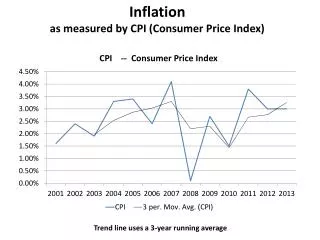
Inflation Inflation refers to the increase in the general level of prices. There are two forms of inflation: • demand pull inflation • cost push inflation.
Demand Pull Inflation This occurs when total (or aggregate) demand in the economy exceeds total supply resulting in an increase in the general level of prices. Controls of demand pull inflation: • Reducing demand in the economy by: • increasing direct taxes. • introducing credit controls. • Increasing interest rates. • Reducing government expenditure.
Cost Push Inflation This occurs when increases in the costs of production are passed on to the consumer in the form of increased prices. • The most common causes are: • Increased wages, • Increased indirect taxes, • Increased cost of imports.
Control of Cost Push Inflation • Decrease indirect taxes – not normally an achievable or viable option. • Control wage increases through: • National wage agreements, • Price and income policy, • Freezing wages • Link wage increases to increases in production only (Productivity deals).
Summary of Problems Caused by Inflation • Causes demands for wage increases. • Discourages saving. • Encourages borrowings. • Encourages speculation. • People on fixed incomes suffer most. • Exports become more expensive. • Imports become relatively cheaper. • Less investment in wealth creating projects.