Download
1 / 26
260 likes | 395 Views
Data Use through Visualization and Storytelling. The presentation will begin at approximately 3 :00 p.m. ET

E N D
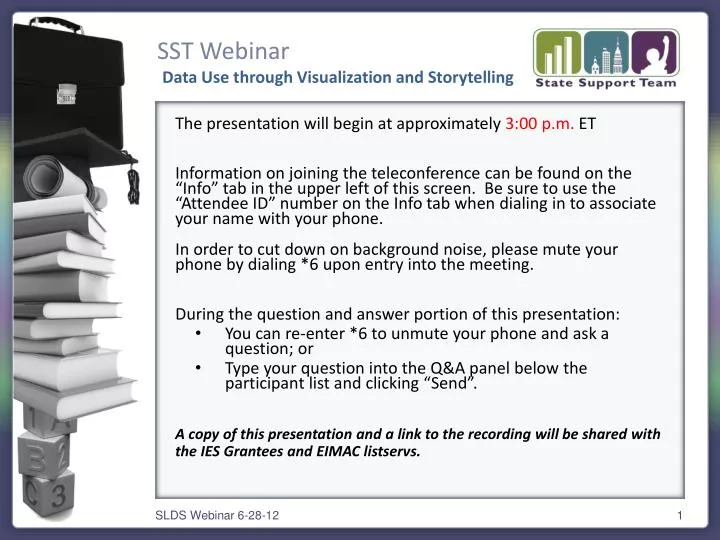
Data Use through Visualization and Storytelling The presentation will begin at approximately 3:00 p.m. ET Information on joining the teleconference can be found on the “Info” tab in the upper left of this screen. Be sure to use the “Attendee ID” number on the Info tab when dialing in to associate your name with your phone. In order to cut down on background noise, please mute your phone by dialing *6 upon entry into the meeting. During the question and answer portion of this presentation: • You can re-enter *6 to unmute your phone and ask a question; or • Type your question into the Q&A panel below the participant list and clicking “Send”. A copy of this presentation and a link to the recording will be shared with the IES Grantees and EIMAC listservs. SLDS Webinar 6-28-12
Data Use through Visualization and Storytelling Panelists Mickey Garrison (Oregon) Peg Votta (Rhode Island) Deb Holdren (Georgia) Agenda How the three states are reaching teachers and engaging them through visualization and storytelling Issues and challenges the states encountered Advice to other states Questions from participants SLDS Webinar 6-28-12
Data Use through Visualization and Storytelling Oregon – Mickey Garrison SLDS Webinar 6-28-12
Data Use through Visualization and Storytelling - OR SLDS Webinar 6-28-12
Data Use through Visualization and Storytelling - OR SLDS Webinar 6-28-12
Data Use through Visualization and Storytelling - OR SLDS Webinar 6-28-12
Data Use through Visualization and Storytelling - OR SLDS Webinar 6-28-12
Data Use through Visualization and Storytelling - OR SLDS Webinar 6-28-12
Data Use through Visualization and Storytelling - OR SLDS Webinar 6-28-12
Data Use through Visualization and Storytelling Rhode Island – Peg Votta SLDS Webinar 6-28-12
Data Use through Visualization and Storytelling - RI Using Data Stories: Rhode Island’s Experience 2008 - History of stalled attempts to share data with sister agencies (Cabinets, Councils, Committees, etc) Limited amount of Federal Funding available (Safe and Drug Free Schools grant) ProvPlan, a Think and Do Partner – RI’s Data Switzerland SLDS Webinar 6-28-12
Data Use through Visualization and Storytelling - RI Data Sources Data Sharing Agreements Executed: RI Department of Education Providence Schools RI Department of Health RI Department of Children Youth, Families RI Office of Higher Education RI Department of Corrections Providence City Agencies Dorcas Place/Full Service Community Schools Providence After School Alliance In the works: Family Court RI Department of Labor and Training RI Department of Human Services SLDS Webinar 6-28-12
Data Use through Visualization and Storytelling - RI A Chronic Absenteeism Data Story What are the effects of chronic absenteeism in high school on post-secondary persistence and success? Appeal to the Novice User Increase multi-audience buy-in Encourage use of data through stories Let the user interact with data http://www.ridatahub.org/datastories/high-school-absenteeism-college-persistence/1/ SLDS Webinar 6-28-12
Data Use through Visualization and Storytelling - RI SLDS Webinar 6-28-12
Data Use through Visualization and Storytelling - RI SLDS Webinar 6-28-12
Data Use through Visualization and Storytelling - RI SLDS Webinar 6-28-12
Data Use through Visualization and Storytelling - RI Challenges and Lessons Learned Different cultures around data sharing, use Hard to illustrate benefits at early stage Some data get very complicated very quickly Interface design for different user levels Trust, Collaboration Training, Capacity Building, COMMUNICATION Vendor vs. Partner Need to DO Something with the data- SLDS Webinar 6-28-12
Data Use through Visualization and Storytelling - RI SLDS Webinar 6-28-12
Data Use through Visualization and Storytelling Georgia – Deb Holdren SLDS Webinar 6-28-12
Data Use through Visualization and Storytelling - GA SLDS Webinar 6-28-12
Data Use through Visualization and Storytelling - GA SLDS Webinar 6-28-12
Data Use through Visualization and Storytelling - GA SLDS Webinar 6-28-12
Data Use through Visualization and Storytelling - GA SLDS Webinar 6-28-12
Data Use through Visualization and Storytelling - GA SLDS Webinar 6-28-12
Data Use through Visualization and Storytelling - GA SLDS Webinar 6-28-12
Data Use though Visualization and Storytelling Questions? Contact Info and Resources: Requests from State Support Team or SLDS Team: Rosemary Collins, (202) 502-7354 rosemary.collins@ed.gov Robin Taylor, (302) 236-2651 robin.taylor@sst-slds.org Panelists: Mickey Garrison, Oregon Department of Education Mickey.Garrison@state.or.us Peg Votta, Rhode Island Department of Elementary and Secondary Education Margaret.Votta@ride.ri.gov Deb Holdren, Georgia Department of Education dholdren@doe.k12.ga.us SLDS Webinar 6-28-12