Download
1 / 32
320 likes | 824 Views
Clustering (1). Clustering Similarity measure Hierarchical clustering Model-based clustering. Figures from the book Data Clustering by Gan et al. Clustering. Objects in a cluster should share closely related properties have small mutual distances

E N D
Clustering (1) Clustering Similarity measure Hierarchical clustering Model-based clustering Figures from the book Data Clustering by Gan et al.
Clustering Objects in a cluster should share closely related properties have small mutual distances be clearly distinguishable from objects not in the same cluster A cluster should be a densely populated region surrounded by relatively empty regions. Compact cluster --- can be represented by a center Chained cluster --- higher order structures
Clustering The process of clustering
Clustering Types of clustering:
Similarity measures A distance function should satisfy
Similarity measures Similarity function:
Similarity measures From a dataset, Distance matrix: Similarity matrix:
Similarity measures Euclidean distance Mahattan distance Mahattan segmental distance (using only part of the dimensions)
Similarity measures Maximum distance (sup distance) Minkowski distance. This is the general case. R=2, Euclidean distance; R=1, Manhattan distance; R=∞, maximum distance.
Similarity measures Mahalanobis distance It is invariant under non-singular transformations The new covariant matrix is
Similarity measures The Mahalanobis distance doesn’t change
Similarity measures Chord distance: the length of the chord joining the two normalized points within a hypersphere of radius one Geodesic distance: the length of the shorter arc connecting the two normalized data points at the surface of the hypersphere of unit radius
Similarity measures Categorical data: In one dimension: Simple matching distance: Taking category frequency into account:
Similarity measures For more general definitions of similarity, define: Number of match: Number of match to NA (? means missing here): Number of non-match:
Similarity measures Binary feature vectors: Define: S is the number of occurrences of the case.
Similarity measures Mixed-type data: General similarity coefficient by Gower: For quantitative attributes, (R is range) , if neither is missing. For binary attributes, if xk=1 & yk=1; if xk=1 or yk=1. For nominal attributes, if xk= yk; if neither is missing.
Similarity measures Similarity between clusters Mean-based distance: Nearest neighbor Farthest neighbor Average neighbor
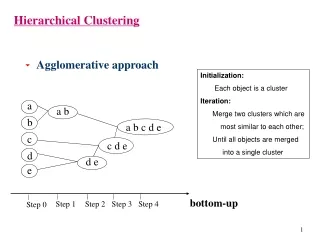
Hierarchical clustering Agglomerative: build tree by joining nodes; Divisive: build tree by dividing groups of objects.
Hierarchical clustering Example data:
Hierarchical clustering Single linkage: find the distance between any two nodes by nearest neighbor distance.
Hierarchical clustering Single linkage:
Hierarchical clustering Complete linkage: find the distance between any two nodes by farthest neighbor distance. Average linkage: find the distance between any two nodes by average distance.
Hierarchical clustering Comments: Hierarchical clustering generates a tree; to find clusters, the tree needs to be cut at a certain height; Complete linkage method favors compact, ball-shaped clusters; single linkage method favors chain-shaped clusters; average linkage is somewhere in between.
Model-based clustering Impose certain model assumptions on potential clusters; try to optimize the fit between data and model. The data is viewed as coming from a mixture of probability distributions; each of the distributions represents a cluster.
Model-based clustering For example, if we believe the data come from a mixture of several Gaussian densities, the likelihood that data point i is from cluster j is:
Model-based clustering Given the number of clusters, we try to maximize the likelihood Where is the probability that the observation belongs to cluster j The most commonly used method is the EM algorithm. It iterates between soft cluster assignment and parameter estimation.
Model-based clustering Gaussian cluster models. Common assumptions: From 1 to 4, the model becomes more flexible, yet more parameters need to be estimated. May become less stable.