Download
1 / 34
340 likes | 346 Views
Economic Impact of Oil and Gas Sector in BC. Dr. Abha Bhargava Canadian Energy Research Institute & Mr. Rob McManus R. McManus Consulting Ltd. January 19, 2005 Fort St. John, BC. Objectives of the Analysis.

E N D
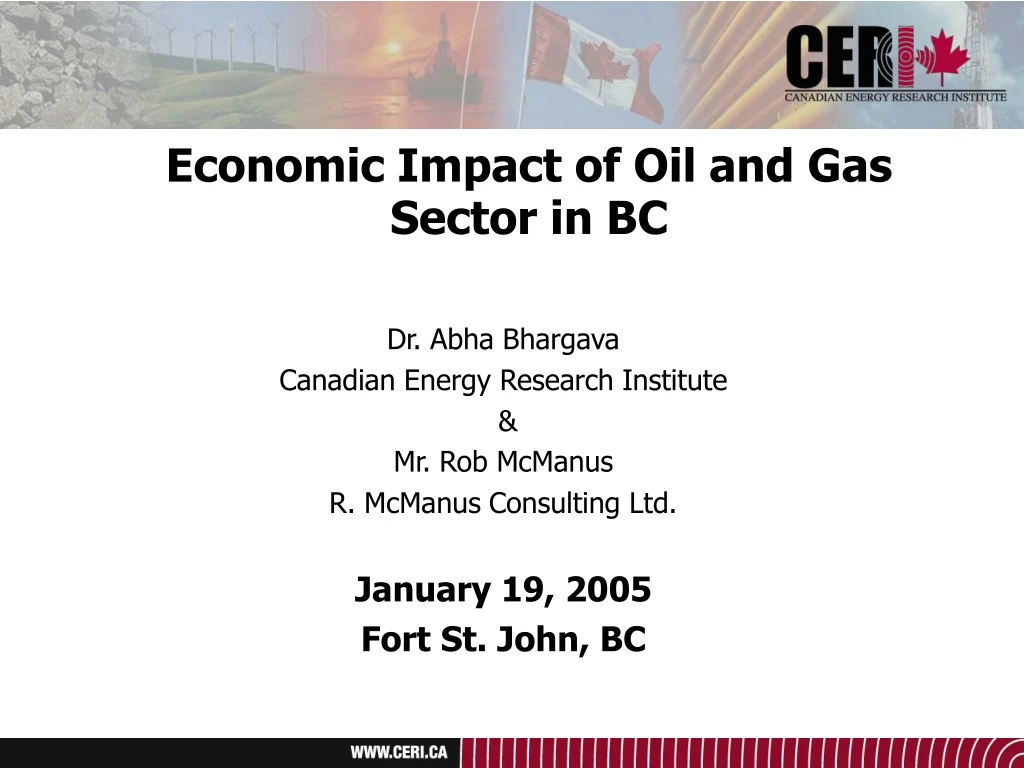
Economic Impact of Oil and Gas Sector in BC Dr. Abha Bhargava Canadian Energy Research Institute & Mr. Rob McManus R. McManus Consulting Ltd. January 19, 2005 Fort St. John, BC
Objectives of the Analysis • Identify expenditure patterns of the oil and gas industry by types of expenditures and where they are made • Identify the significance of the oil and gas industry to both the Northeast and provincial economies • Create economic models to assess future impact of the oil and gas industry price, fiscal and production scenarios
Key Study Components • Survey to capture expenditure data • Construction of BC Oil and Gas Model • Approach similar to oil and gas supply model (OGSM) of the US Department of Energy Modelling System (NEMS) • Calculates oil and gas production and investment as inputs to Macroeconomic models • Macroeconomic models (Northeast & British Columbia) • I/O Based General Equilibrium Models • Identifies the total impact of changes in the oil and gas sector
Oil & Gas Sector Expenditures in BC • Oil and gas sector investment increased gradually between 1985 and 1999 • During 1999-2001 it increased rapidly from 1.6 billion dollars to 3.7 billion dollars.
Oil and Gas Industry shares in Total GDP in B.C. and the Northeast Region (%) Source: Statistics Canada and the Center for Spatial Economics
Four Distinct Phases of Oil and Gas Field Exploration – Searching for Petroleum • Geophysical, Seismic, Drilling Development – Drilling wells/Laying Pipe • Engineering, Drilling, Fabrication, Construction Production – Recovering the Resource • Engineering, Operations, Processing, Shipping Decommissioning - Abandonment – Removal of Facilities • Engineering, Environmental, Construction
Oil and Gas Business TrendsAffecting NEBC • Global Nature of Industry -- goods & service centres • Industry consolidation • Global & North American centres • Locational & other decision factors influencing where industry centres develop • Local service businesses • Regional service businesses • National and International service businesses
CERI Expenditure Analysis • Based on survey of companies in oil and gas industry: • Large, medium and small producers • Service and Supply companies: (i) drilling, (ii) seismic and (iii) all other service and supply companies
Oil & Gas Producers Land Acquisition & Rentals Geological & Geophysical Well Drilling & Completion Production & Operation (including gathering & processing) Constru-ction of Facilities Others Service & Supply Companies Drilling Companies Seismic Companies Service & Supply Companies Directly Hired Labor Purchased Goods Purchased Services NE BC (%) Other BC (%) Labor Goods Services Out of BC (%) NE BC (%) Other BC (%) Out of BC (%) The Overall Survey Approach
The Survey Process Face-to-Face Meetings with Select Producers and Oil and Gas Associations Focus Group Meeting with Producer & Drilling Companies Finalization of Survey Instruments with Input from Ministry and Industry Survey Mail- out Multi-layered Follow-up
Total Expenditures for Oil and Gas Producers (2002) • Directly Hired labour: Oil and gas producer’s regular employees (i.e., internally hired) involved in oil and gas activities in Northeast region of BC and directly contracted • fulltime consultants for the same purpose. • Directly Purchased Goods and Services: All goods & services directly purchased by the company. It excludes goods and services purchased through a service and supply company. • Indirectly Purchased Goods and Services: All goods & services purchased through a service and supply company.
Activity Shares of the Oil and Gas Producers (2002) Drilling, production & operation and facility construction account for almost equal shares in total expenditures on directly hired labour. Drilling and construction of facilities are main activities in terms of expenditures on purchased goods (e.g., goods purchased for casing and cementing; drilling bits, surface mud and chemicals).
Total Expenditures for All Service and Supply Companies (2002) Labour:Total labour including directly hired or associated with purchased services from the third party. Goods & Services: All goods and services including both directly purchased or associated with services from the third party.
Components of “All Service and Supply Company” Expenditures on Goods and Services Major goods and services normally procured directly or through the third party by the service and supply companies including fuel, equipment and machinery and trucking and transportation. Equipment & machinery including construction equipment, part rental, office supplies, machine parts etc., accounts for two thirds of the service and supply companies’ total expenditure on goods and services.
Shares of Drilling and Service Rigs Drilling activities are divided into two groups based on whether the activities are related to drilling (drilling rig) or servicing (service rig). The trend shows that the share of drilling rig is increasing, whereas the share of service rig is decreasing. This may result from deeper well drilling over the years.
Shares in the Total Drilling Expenditures (2002) Major drilling expenditure items include fuel, labour, repair and maintenance. Labour is a key expenditure item in drilling accounting for about 70% of total service rig expenditures and 55% of drilling rig expenditures. Minimal change in the expenditure structure by items has taken place during the last five years.
Shares by Activity in Seismic Expenditures (2002) Seismic includes land clearing (timber damage, cat cutting, slashing line, extra slash, snow files); surveying (cat push and survey), down hole (trucking, drilling, drill push, down hole); recording (recording and supervision); and others (permit agents and fees, safety, medical, inspection, accommodation and processing).
Other Service and Supply Company Expenditures by Type in 2002 (%) Other service and supply refers to all service and supplies except drilling and seismic services. Goods and service expenditures include both directly procured and third party (or indirect) purchases. Major goods and services normally procured directly or through the third party by the general service and supply companies include fuel, equipment and machinery and trucking and transportation.
Where are goods, services and labour sourced? Why? • Kinds of goods needed, and where they are manufactured • exploration, development, production, abandonment • Kinds of skills and services needed and where they are sourced • exploration, development, production, abandonment • Influences for expenditure decision making • Why are producers and service sector expenditure patterns different
Producer Direct Expenditures O&G producers (2002) • 30% of direct labour expenditures made within the province. • North-eastern BC labour is involved in production, operation, and facility construction activities undertaken by the oil and gas producers • 12% of direct goods and service expenditures made within the province • Direct goods and service expenditures include purchases made directly by oil and gas producers for drilling, production & operation and construction activities. • Direct spending by O&G producers is 39% of total expenditures.
“All Service and Supply Company” Expenditures Service and supply companies (2002) • 63% of direct labour expenditures made within the province. • 47% of direct goods and services expenditures made within the province. • Labour sourced in BC includes those physically working in BC, irrespective of their origins. • The service and supply activity includes all types ofservice and supply including drilling, seismic, construction, well completion and testing, environmental services and such others.
Expenditure Patterns Of the total expenditures 55% is spent on goods & services and the remaining 45% is spent on labor About 40% of the total expenditure is made in the province
Expenditure Patterns (cont.) 39 % of all producer expenditures are direct expenditures on goods, services and labour PRODUCERS Make Initial Expenditures Within BC Outside of BC Drilling Companies Within BC Outside of BC 61% of all producer expenditures are made to third party Service and Supply (S&S) companies Seismic Companies Within BC Outside of BC All Other S&S Companies Within BC Outside of BC
Summary • The oil and gas industry has a major impact on the provincial economy as measured by GDP: • Per $1 additional 1997 dollars investment in natural gas well development and extraction, $2.5 additional 1997 dollars of GDP are generated in British Columbia. For the Northeast, the impact is $1.29 additional GDP. • About 40% ($1.4 billion) of all industry expenditures remain in BC. • Primary reasons for sourcing labour, goods and services outside BC are: use of large, national supply contracts; shortened activity window, labour demand exceeds local supply; and provincial tax regime.
Impact per $1 Additional Investment in Natural Gas Well Development and Extraction
Sustaining the Growth • Addressing the availability issue • Drilling incentives (i.e. Summer Drilling Program, • Deep Drilling Program, etc.) • Infrastructure Development • Removing Fiscal Barriers • Standardised Regulatory Regime in Western • Canada
Sustaining the Growth Return to Ministry of Energy and Mines Oil and Gas Division Publications Page