Download
1 / 23
230 likes | 358 Views
Measuring plant abundance and ecological processes with the pin-point method. Christian Damgaard Department of Bioscience Aarhus University. Next generation ecoinformatics From plant occurrence to plant abundance and growth Predictive process-based ecological models

E N D
Measuring plant abundance and ecological processes with the pin-point method Christian Damgaard Department of Bioscience Aarhus University
Next generation ecoinformatics From plant occurrence to plant abundance and growth Predictive process-based ecological models Refining classic ecological hypotheses Need to develop the measurement framework Special data structures True statistical inferences Plant abundance data
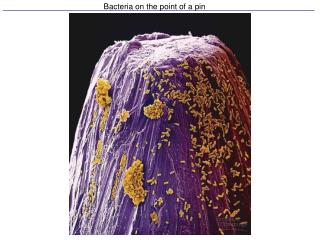
Method for measuring: i) cover ii) vertical density Place a frame with a grid pattern A pin is inserted vertically through one of the grid points into the vegetation The pin will typically touch a number of plants and the different species are recorded (to determine cover) The number of times the pin hits the same species is also recorded (to determine vertical density) This procedure is repeated for each grid point The pin-point (point-intercept) method
Plant cover data has too many zero values and too much variance compared to a binomial distribution U- shaped distributions of plant cover are typical Large-scale ecological processes (among-sites): environmental drivers extinction / colonization of sites Small-scale ecological process (within-sites): size of individuals density-dependent population growth inter-specific competition Hierarchical plant cover data
Beta-binomial distribution q : mean cover at the site d : intra-plot correlation
Relationship between plant cover and intra-plot correlation in dune grasslands
The cover of Calluna vulgaris and Deschampsia flexuosa on dry heathlands Important to include spatial correlation
If d was set to zero (no spatial correlation) then there was a strong significant effect (grey line, P < 0.0001) If d was allowed to vary then the effect was found to be insignificant (black line, d = 0.57, P = 0.19) Important to include spatial correlation
Separation of process and sampling variance • Process equation (solid error) • Dxi =a + eiei ~ Normal(0,sp2) • Measurement equation (dashed error) • yi,j ~ Beta-binomial Distribution (n, xi, d)
Is the cover of Erica tetralix regulated by nitrogen deposition or pH or both?
The use of relevant parametric distributions are needed to test ecological hypotheses Erroneous conclusions, if spatial variation is ignored State-space models and SEM are flexible tools for modeling different ecological processes The measurement equations can be tailored to accommodate different measures of plant abundance pin-point method Visual estimation, Braun-Blanquet,Hult-Sernander Böcher-modified Raunkjærmethod … Second-order statistics – from pattern to process Two species n species Conclusions
Evidence for competitive interactions in plant communities • How often has the competitive interactions in a plant community been measured in a natural plant community compared to the times competition has been postulated to be an important ecological mechanisms? • 1/1000 is certainly too high • 1/1000,000?
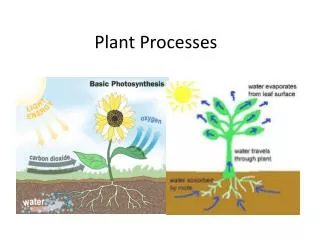
Measuring ecological success • Natural and semi-natural plant communities are dominated by spatially structured perennial species with variable life histories • Often difficult to count individual plants • Large size variation among individuals of the same species. • The ecological success may be assessed using the pin-point method • cover(= relative area that the species cover) • vertical density (= 3D space occupancy ~ biomass, plant volume, and LAI)
i) Plant cover and vertical density measure ecological success ii) Due to the growth form of most plant species, the vertical density will increase relatively faster than plant cover during the growing season iii) Species with a high cover in spring will have relatively high vertical density at the end of the growing season, however, the vertical density is reduced by the cover of other species due to competition Plant cover and vertical density – assumptions • iv) A plant species that grows to a relatively high vertical density has a relatively high cover the following year, i.e., plants allocate resources into occupying resource space the following year
Case study: dry heathlands • Ambient treatments in the CLIMAITE experiment • Calluna vulgaris and Deschampsia flexuosa are the dominating species and are expected to compete for resources
Significant competitive interactions between • C. vulgaris and D. flexuosa • Bayesian posterior distribution of the parameter that measures the competitive effect of C. vulgaris on D. flexuosa within growing seasons • MCMC – 100.000 iterations
Inserting samples from the joint posterior distribution into the model makes it possible to test compound hypotheses Assuming that the measured competitive interactions were unaltered C. vulgaris was predicted to outcompete D. flexuosa Predictedchange in plant cover However, individuals of C. vulgaris becomes senescent after about 30 years
“Demography” of space occupancy • For a selected species there are four possible successive pin-point recordings at a fixed position: • 1. the selected species was hit both years • 2. the species was not hit in any of the years • 3. the species was only hit the first year • 4. the species was only hit the second year • Event #3 – species has disappeared from the space – possibly due to death? • Event #4 – species has appeared at the space – possibly due to colonisation or growth?
Quantifying the importance of survival and colonisation • The maximum likelihood estimates of the probabilities of “survival” and “colonisation” are calculated using the expected probabilities of the four possible events (Damgaard et al. 2011) • The elasticity of the change in plant cover to both survival and colonisation are calculated, i.e., is the change in cover primarily caused by altered mortality or altered recruitment?
Longitudinal species abundance data are needed for measuring ecological processes, e.g. growth, competition, mortality, and space colonisation Joint posterior distributions of the parameters in a population model allows the examination of compound ecological question, e.g. probability of extinction Conclusions
In collaboration with: • Inger Kappel Schmidt • Johannes Ransijn • Beate Strandberg • Knud Erik Nielsen • Morten Strandberg • and others…