Download
1 / 39
400 likes | 748 Views
South Carolina Forest Land. KY. VA. TN. OK. NC. AR. SC. MS. AL. GA. LA. TX. FL. Source for Forest inventory and Analysis Data : USDA Forest Service, SRS South Carolina Forestry Commission. The South’s Forestland by State, 1998. 25. 20. 15. Acres. Million. 10. 5.

E N D
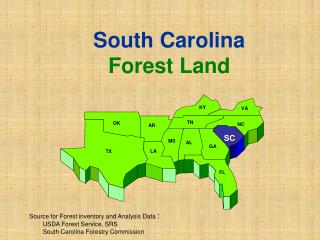
South Carolina Forest Land KY VA TN OK NC AR SC MS AL GA LA TX FL Source for Forest inventory and Analysis Data : USDA Forest Service, SRS South Carolina Forestry Commission
The South’s Forestland by State, 1998 25 20 15 Acres Million 10 5 0 Texas Florida Georgia Virginia Alabama Arkansas Kentucky Louisiana Oklahoma Tennessee Mississippi North Carolina South Carolina Source: Sheffield, USDA Forest Service, SRS, FIA Data South Carolina ranks 10th in acreage of commercial timberland in the Southeast.
The distribution of ownerships in SC parallel closely with the Southeast (13 states). A total of 90% of the landowners in SC are private nonindustrial landowners and forest industry. * FIA 2000 data is preliminary representing 60% of the total plots to be sampled. Source: USDA Forest Service, SC Forestry Commission, FIA Data ** Industry includes leased Private lands.
South Carolina has a fairly even distribution of forest types demonstrating diversity of the forests. * FIA 2000 data is preliminary representing 60% of the total plots to be sampled. Source: USDA Forest Service, SC Forestry Commission, FIA Data
Pine plantation Natural pine Upland hardwood Oak–pine Bottomland hardwood Forest Type Distribution by State Source: Sheffield, USFS, FIA Data.
* FIA 2000 data is preliminary representing 60% of the total plots to be sampled. Source: USDA Forest Service, SC Forestry Commission, FIA Data The trend in SC for the past 15 years, as well as the SE, is the divesting of large land holdings by forest companies. Pension funds and partnerships are purchasing much of these large acreages. Industry consolidation and present tax laws have been a major force in this trend, and this trend is expected to continue.
* Growing Stock is inventory of commercial trees at least 5 inches in diameter in the forest. ** FIA 2000 data is preliminary representing 60% of the total plots to be sampled. Source: USDA Forest Service, and SC Forestry Commission, FIA Data Total growing stock volume has increased 111% since 1958. Softwood has increased 106% (or by 4.6 billion cubic feet). Hardwood has increased 117% (or by 4.7 billion cubic feet). Note that Hurricane Hugo (1989) destroyed an estimated 2.5 billion cubic feet and only 387 million cubic feet (15%) was salvaged and is reflected in the 1993 data. The amount of timber destroyed in one day was equivalent to approximately 4 years of harvesting.
Source: USDA Forest Service, FIA Data, 1993 Forestry has come under criticism of converting too much forestland to planted pine. The perception is that much of the hardwood forests are being converted to pine. The actual trend is demonstrated above showing the conversion of natural pine sites to planted pine. Hardwood area remains relatively constant for the last 50 years.
Source: USDA Forest Service, FIA Data, 1993 For the last 25 years, forest acreage has remained constant, while forest land ownerships have changed significantly. Individual and corporate landowners have increased in area, industry has increased slightly and is presently in a downturn, while farm ownership of forest land has decreased almost 46 percent. Farm land acreage (crop and pasture acreage) has decreased 34.6 % from 1958 to 1993.
Source: SC Forestry Commission During the decade of of the 1990s, SC planted an average of 146,000 acres per year.
Source: SC Forestry Commission South Carolina has been a leader in the SE in regard to acres planted relative to timberland acreage. The first spike of acres planted is the Soil Bank Program, and the second spike represents the Conservation Reserve Program (CRP).
* FIA 2000 data is preliminary representing 60% of the total plots to be sampled. Source: USDA Forest Service, SC Forestry Commission, FIA Data Softwood growing stock is showing remarkable recovery from the hurricane Hugo devastation (1989). With proper management, there should be an increase in growing stock volume for the 10 to 14 inch diameter classes in the next 10 years.
* FIA 2000 data is preliminary representing 60% of the total plots to be sampled. Source: USDA Forest Service, SC Forestry Commission, FIA Data The distribution of hardwood diameter classes has not shown significant change I the last 22 years.
> 800 400 - 800 200 - 400 100 - 200 0 - 100 Population density map for North Carolina, South Carolina, and Georgia # of People Per Square Mile* * 1999 population estimates by CACI International, Inc. based on 1990 US Census Virginia Study (D. Ware, et al., USDA Forest Service,1998) At approximately 45 people/square mile, there is a 50:50 chance of practicing forestry. At 150 people/square mile, forest management approaches zero.
Forecast Change in Forest Land 1992-2010 f o r e s t c h a n g e > 1 4 % l o s s 8 - 1 4 % l o s s 1 - 8 % l o s s s t a b l e > 1 % g a i n Source: USDA Forest Service, SRS
52% of the saw logs 77% of the pulpwood 66% of the plywood and veneer 42% of the composite panel 59% of total product output The Southeast Supplies Source: Johnson, USFS, TPO Data, 1997.
Value of Products to the Southeast Hardwood Softwood Total (Billions of dollars) Saw logs 5.0 1.2 6.2 Veneer 1.2 .168 1.35 Pulpwood 2.0 1.1 3.1 C. Panel .083 .039 .122 Other .269 .626 .895 All Products 8.494 3.133 11.627 Delivered to mill prices Source: Johnson, USDA Forest Service, TPO Data, 1997.
*Stumpage is the value of trees standing in the forest. The chart represents a total of all roundwood types, and also reflects an increase in production over time. When assessing value and production together in terms of value per cubic foot ($/cu.ft.), there is a 87.4 % increase in delivered value over the 20 year period, or 4.4%/year (simple interest and constant dollars). Total value was calculated by using timber product output data and average stumpage and delivered values by products from Timber Mart-South. Compiled by Clemson University from USDA Forest Service TPO Data and Timber Mart-South
Forest land base is stable Overall mix of pine and hardwood has not changed greatly in 5 decades and is not expected to change significantly in the future Pine component moving steadily toward more planted stands…fewer natural Greater private ownership will keep the south’s forests productive and in demand Maximum sustainable harvest levels in sight but no indication of running out of timber in the future Summary
Potential constraints on timber supply: Timberland Operability - adverse sites, best management practices Timberland Availability - ownership, policy, and government control Age Structure and Stocking - past management and Hugo’s impact Policy Issues - set asides, harvesting restrictions, and potential regulations Lack of knowledge and incentives for private non-industrial landowners to practice sustainable forestry Lack of proactive public participation by the forestry community
Opportunities to increase growth and yield Regeneration with improved seedling stock Commercial thinning where feasible Harvest and regenerate at maturity Salvage and regenerate when appropriate Continue investments in R & D Other stand improvements where feasible
1,073,521 Total Tons 85% Softwood 15% Hardwood Source: USDA Forest Service, TPO Data, 1993
Wood Residue Disposal in SC Source: USDA Forest Service, TPO Data, 1997
Annual Forest Biomass Residuals From Timber Harvesting Pine ~ 4.1 Million Tons Hardwood ~ 5.2 Million Tons
1.1 million participated in wildlife recreation annually Annual expenditures top $1.5 billion $30 million annually for land-use access fees to private landowners Source: 1996 National Survey of Fishing, Hunting, and Wildlife-Associated Recreation Economic Value of Wildlife in South Carolina
Hunting in SC Annually Generates …. 10,677 jobs $357 million in retail sales $192 million in salaries and wages $23 million in state and federal taxes $18 million in sales tax $658 million in total economic effects Source: 1996 National Survey of Fishing, Hunting, and Wildlife-Associated Recreation Economic Value of Wildlife in South Carolina
Hunting in SC # of hunters 300,000 Days of hunting 6,921,000 Days/hunter 23 Average/hunter $1,150 Average/day $17 Economic Value of Wildlife
Types of Hunting in SC#Hunters Deer 245,000 Dove 71,000 Squirrel 56,000 Wild Turkey 53,000 Ducks 44,000 Rabbit 40,000 Quail 34,000 Economic Value of Wildlife
Annual Fishing in SC ... Total Participants 986,000 Residents 638,000 NR 349,000 Total Expenditures $707 million Average/Participant $717 Source: 1996 National Survey of Fishing, Hunting, and Wildlife-Associated Recreation Economic Value of Wildlife in South Carolina
Annual Wildlife Activities# People Feed Wildlife* 761,000 Observe Wildlife 577,000 Photograph Wildlife 172,000 Maintain Natural Areas 154,000 Maintain Plantings 127,000 Visit Public Areas 101,000 Source: 1996 National Survey of Fishing, Hunting, and Wildlife-Associated Recreation *Cash receipts for sunflower seed production for wildlife in SC surpassed other agriculture crops in 2000 (Ed Murdock, personal communication) Economic Value of Wildlife in South Carolina
Wildlife Watching in SC Total Participants 1.1 million Residents 817,000 NR 408,000 Total Expenditures $3 million Average/Participant $290 Economic Value of Wildlife
Permits Fee Hunting (dove fields) Fee Fishing Shooting Preserves Sporting Clays Non-consumptive Fee Access Hunting Leases Landowner Income Alternatives from Wildlife-Related Activities
Summary Points to Remember... Natural resources (forest, wildlife, & fisheries) surpasses agriculture in total economic importance to SC Diversifies farm/forest land income and compliments traditional land-use & management