Download
1 / 55
570 likes | 832 Views
http://www.ebi.ac.uk/metagenomics. Hubert DENISE hudenise@ebi.ac.uk. 1997 PhD. Molecular Parasitology Univ. Bordeaux II, France. About me. 2003 – 2005 Lecturer Molecular Biology, Univ. Clermont-Ferrand II, France. 1997 - 2003 PostDoc , WCMP Univ. Glasgow, UK.

E N D
http://www.ebi.ac.uk/metagenomics Hubert DENISE hudenise@ebi.ac.uk
1997 PhD. Molecular Parasitology Univ. Bordeaux II, France About me 2003 – 2005 Lecturer Molecular Biology, Univ. Clermont-Ferrand II, France 1997-2003 PostDoc, WCMP Univ. Glasgow, UK 2011 – 2012 MSc. Bioinformatics Univ. Cranfield, UK 2005 - 2011 Sr. Scientist, Pfizer Ltd Sandwich, UK 2012 Bioinformatician Sanger Institute then EBI, Hinxton, UK
Where is the true cost of NGS ? 14.5 % 30 % 28 % (~2m bp/$) 4.5 % 70 % (~80 bp/$) 14.5 % 55 % 36.5 % 14.5 % Sboner et al.Genome Biology (2011) 12:125
EBI Metagenomics pipeline • Philosophy • Submission to EBI Metagenomics • QC steps • Overview of functional analysis • Overview of taxonomy analysis • Metagenome assembly • Result outputs • Others public pipelines Data analysis using selected EBI and external software tools
Philosophy behind EBI Metagenomics pipeline Helping metagenomics researchers make sense of their data • From chaos to structure: • archiving of data with metadata • performing stringent QC filtering prior to analysis • quality in, quality out • performing robust taxonomy and functional analysis • model-based rather than similarity-based approaches • assignment done on reads rather than assembly • intuitive navigation through website • constant drive to improvement • benchmarking and tool testing
EBI Metagenomics pipeline • Philosophy • Submission to EBI Metagenomics • QC steps • Overview of functional analysis • Overview of taxonomy analysis • Metagenome assembly • Result outputs • Others public pipelines Data analysis using selected EBI and external software tools
secure login http://www.ebi.ac.uk/metagenomics Navigation panes Resource stats Latest data and news
Submitting to EBI Metagenomics • Your data is valuable to you • Raw sequence data • Description of sample and experiment (samplemetadata) • Analysis steps and results • All of this needs to be captured and stored to give context to your data • If so, your data can also be valuable to others
Submitting to EBI Metagenomics • EBI Metagenomics want to encourage people to supply as much detailed metadata as possible, but with the lowest possible overhead • Development of intuitive web-based tools : ENA Webinand ISA tools • Use of templates and check-lists (MIGS/MIXS standards) • Tutorial and direct support who where, when, what how
EBI Metagenomics pipeline • Phylosophy • Submission to EBI Metagenomics • QC steps • Overview of functional analysis • Overview of taxonomy analysis • Metagenome assembly • Result outputs • Others public pipelines Data analysis using selected EBI and external software tools
Metagenomics data analysis Diversity analysis Quality control Functional analysis Image credits: (1) Christina Toft & Siv G. E. Andersson; (2) Dalebroux Z D et al. Microbiol. Mol. Biol. Rev. 2010;74:171-199
Overview of EBI Metagenomics Pipeline raw reads trim and QC reads without rRNA processed reads remove short rRNAselector remove duplicates reads with rRNA predicted CDS discarded reads FragGeneScan Amplicon-based data Qiime Unknown function pCDS InterProScan Taxonomic analysis Function assignment
EBI Metagenomics: QC rationale Why ? • Garbage in, garbage out • Base call error: - each base call has a quality score associated • - specific platform-dependent errors • Reads quality decreases with reads length • NGS generates duplicate reads (false and real). Reducing duplication reduces analysis time and prevent analysis bias.
EBI Metagenomics: QC step by step • Clipping- low quality ends trimmed and adapter sequences • removed using BiopythonSeqIOpackage • Quality filtering - sequences with > 10% undetermined nucleotides removed • Read length filtering- short sequences are removed • Duplicate sequences removal - clustered on 99% identity (UCLUST v 1.1.579) and representative sequence chosen • Repeat masking - RepeatMasker (open-3.2.2), removed reads with 50% or more nucleotides masked
EBI Metagenomics: QC consequences Roche 454 Ion Torrent Illumina
EBI Metagenomics: overview of functional analysis reads without rRNA predicted CDS FragGeneScan Unknown function pCDS InterProScan Function assignment
EBI Metagenomics: identification of coding sequences • Prediction of coding sequences is a challenge • read length • sequencing errors: frame-shift • Two main types of approaches: • homology-based methods: identify only known coding sequences • feature-based approaches: predict probability that ORFs are coding • EBI Metagenomics uses FragGeneScan : • hidden Markov models to correct frame-shift using codon usage • probabilistic identification of start and stop codons • 60 bp minimum ORF Rho et al. (2010) NAR 38-20
EBI Metagenomics: annotation of coding sequences • Most available pipelines use pairwise alignment methods (such as BLAST) • compare a query sequence with a database of sequences • identify database sequences that resemble the query sequence with homology score above a certain threshold • However sequences may appear to have low homology score because: • proteins may share homology only in limited domains • proteins from different species can differ in length • Example: first line of blast alignment of 60S acidic ribosomal protein P0 from 2 closely-related species
EBI Metagenomics: advantage of InterPro EBI Metagenomics pipeline do not use BLAST-based methods to associate functions to predicted protein sequences: instead we use InterProScan to mine the InterProdatabase. InterPro database (HMM and profile –based functional analysis)isbased on presence of “signatures” (models) from eleven databases Specificity: mapping is manually curated IPR024185: 5-formyltetrahydrofolate cyclo-ligase-like IPR000847: Transcription regulator HTH, LysR • Speed Test set of 40,692 predicted protein sequences • BLAST vs UniRef100 = 21.5 s/cds • InterProScan (5 databases) = 3 s/cds
EBI Metagenomics: InterProScan annotations member database signature accession signature description pCDS SRR413626.9733695_1_1_105_- ProSitePatternsPS00194 Thioredoxin family active site 1.0E-13 IPR017937Thioredoxin, conserved site GO:0045454 score InterPro accession InterPro description GO annotation
EBI Metagenomics: InterProScan annotations signatures links description GO terms
Aims of the Gene Ontology • Controlled vocabulary • Unify the representation of gene and gene product attributes across species • Allow cross-species and/or cross-database comparisons
Inconsistency in naming of biological concepts English is not a very precise language • Same name for different concepts • Different names for the same concept An example … Taction Tactition Tactile sense ? Sensory perception of touch ; GO:0050975
The Gene Ontology Less specific concepts • A way to capture biological knowledge in a written and computable form • A set of concepts • and their relationships • to each other arranged • as a hierarchy More specific concepts www.ebi.ac.uk/QuickGO
The Concepts in GO • protein kinase activity • insulin receptor activity 1. Molecular Function An elemental activity or task or job 2. Biological Process A commonly recognised series of events • cell division • mitochondrion • mitochondrial matrix • mitochondrial inner membrane 3. Cellular Component Where a gene product is located
The relationship between InterPro and GO (InterPro2GO) • Curators manually add relevant GO terms to InterPro entries • When a sequence is searched against InterPro, it is assigned GO terms by virtue of the entries it matches SRR413626.11302948_1_1_133_+ Pfam PF00005 ABC transporter 6 8.9E-6 IPR003439 ABC transporter-like GO:0005524|GO:0016887 ATP binding ATPase activity
EBI Metagenomics: overview of taxonomy analysis processed reads rRNAselector reads with rRNA Amplicon-based data Qiime Taxonomic analysis
EBI Metagenomics: identification of suitable sequences • Taxonomy analysis is generally based on identification and classification of rRNA sequences • Prokaryotes: archaebacteria and eubacteria: 5S, 16S and 23S • Eukaryotes: 5S, 5.8S, 18S and 28S • there is no equivalent for virus so depend on DNA polymerase or part of 5’-UTR (internal ribosomal entry site [IRES]) sequences • EBI Metagenomics currently only provide taxonomy analysis for Prokaryotes. • rRNA sequences are identified using rRNASelector : • hidden Markov models to identified rRNA sequences • 60 bp minimum overlap with well-curated HMM model • E-value < 10-5 Lee et al (2011) J Microbiol. 49(4)
EBI Metagenomics: identification of suitable sequences Once identified, rRNA sequences are clustered and classified using Qiime “QIIME stands for Quantitative Insights Into Microbial Ecology. QIIME is an open source software package for comparison and analysis of microbial communities” • The main steps are: • clustering sequences in Operational Taxonomy Unit (OTU) using uclust • picking a representative sequence set (one sequence from each OTU) • aligning the representative sequence set • assigning taxonomy to the representative sequence set using PyNAST • generating output files: • filtering the alignment prior to tree building • building phylogenetic tree • creating OTU table
EBI Metagenomics: validation of taxonomy analysis Re-analysis of: Sutton et al, Appl. Environ. Microbiol (2013), 79(2):619 Impact of Long-Term Diesel Contamination on Soil Microbial Community Structure. Alpha diversity analysis clean polluted clean (outlier)
Assembly of metagenomics data • Metagenomics: Not clear how you avoid assembling sequences from different species together : chimaera • No reference sequence to align against
EBI Metagenomics currently do not perform assembly • We are still able to annotate metagenome as show by this re-analysis of Rumen metagenomics by Hess et al, Science (1011) 331:463 • What are the consequences? • cannot link taxonomy information to functional annotations • cannot currently perform viral taxonomy analysis
EBI Metagenomics pipeline in a nut shell • QC : • - trim adaptor sequences, low quality sequence ends • - remove duplicates and short sequences • - remove low complexity sequences, “Powerful and sophisticated alternative to BLAST-based functional metagenomic analysis” • Diversity analysis : • - identify prokaryotic rRNAsequences (5, 16 and 23s) • - cluster rRNA-containing reads • - assign taxonomy classificationusingQiime, • Functional analysis : • - predict ORFs • - translate ORFs into peptides • - submit to InterProScan for functional annotation
EBI Metagenomics pipeline • Submission • Philosophy • Overview data analysis • QC steps • Overview of functional analysis • Overview of taxonomy analysis • Metagenome assembly • Result outputs • Others public pipelines Data analysis using selected EBI and external software tools
Current outputs of EBI Metagenomics pipeline Visualisation - QC and sequence statistics Download - Diversity analysis - Functional analysis
Current outputs of EBI Metagenomics pipeline navigation tabs Access via the Sample page
EBI Metagenomics pipeline: taxonomy visualisation switch to bar chart, column or Krona interactive views Krona interactive representation Google charts dynamic representation
EBI Metagenomics pipeline: functional visualisation Google charts dynamic representation links to InterPro website switch to bar chart view
EBI Metagenomics pipeline : download options 470 MB: need high computing power to manipulate: EBI Metagenomics take care of it and extract meaningful information sets relatively small files: can be manipulated on labtop/desktop computer: users can filtered them according to their needs
EBI Metagenomics pipeline • Submission • Philosophy • Overview data analysis • QC steps • Overview of functional analysis • Overview of taxonomy analysis • Metagenome assembly • Result outputs • Others public pipelines Data analysis using selected EBI and external software tools
Metagenomics data analysis Quality control Quality control Pipeline 2 Pipeline 1 Taxonomy analysis Taxonomy analysis Functional analysis Functional analysis results 1 results 2 • should share trends and main findings • could differ in ratio and assignment
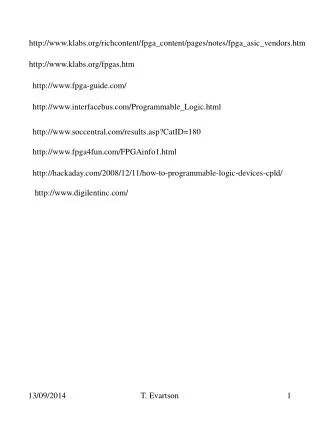
Public Metagenomics portals http://metagenomics.anl.gov/ http://www.ebi.ac.uk/metagenomics/ http://img.jgi.doe.gov/ http://camera.calit2.net/
Simplified overview of MG-RAST pipeline Sequencer output Quality control Feature prediction (FragGeneScan) Abundance profiles Similarities search Blat Clustering (Uclust) http://metagenomics.anl.gov/ • Community reconstruction • Metabolic reconstruction • Metabolic model
MG-RAST and EBI Metagenomics QC comparison Example: Analysis of Prairie Soil Sample
MG-RAST and EBI Metagenomics Functional analysis Example: Analysis of Prairie Soil Sample ammonia monooxygenase: NH3+A-H2+O2NH2OH+A+H2O MG-RAST: 28 unique hits on 8 different protein databases 1 ammonia monooxygenase family protein 2 ammonia monooxygenase subunit A 1 ammonia monooxygenase, putative 6 putative ammonia monooxygenase 2 Putative ammonia monooxygenase 1 putative ammonia monooxygenase subunit A 12Ammonia monooxygenase 2 ammonia monooxygenase family protein 4Ammonia monooxygenase subunit A 5Ammonia monooxygenase, putative 62 Putative ammonia monooxygenase 3 putative ammonia monooxygenase protein 4 putative ammonia monooxygenase subunit A 8KEGG 18eggNOG 13 GenBank 11 IMG 8 PATRIC 10 RefSeq 12 TrEMBL 9SEED • 13GenBank 1 putative ammonia monooxygenase 3 Putative ammonia monooxygenase 5 Ammonia monooxygenase • 9SEED what do the abundance numbers mean ? EBI Metagenomics: 3 IPR003393 Ammonia monooxygenase/particulate methane monooxygenase, subunit A 25 IPR007820 Putative ammonia monooxygenase/protein AbrB
MG-RAST and EBI Metagenomics Taxonomy analysis Example: Analysis of Prairie Soil Sample MG-RAST domain level of taxonomy (55 categories) (15 categories) (98 categories) (3 types) EBI Metagenomics only Archae/Bacteria taxonomy (333 OTU)
Some other Metagenomics tools http://ab.inf.uni-tuebingen.de/software/megan/ http://cbcb.umd.edu/software/metAMOS http://www.computationalbioenergy.org/software.html