Download
1 / 15
160 likes | 350 Views
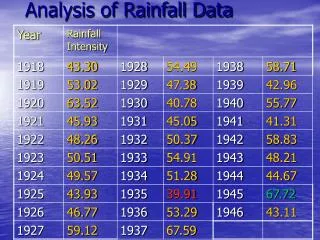
Analyses of Rainfall. Hydrology and Water Resources RG744 Institute of Space Technology October 04, 2013 . Mean Rainfall. Mean Annual Rainfall: determined by averaging the total rainfall of several consecutive years at a place

E N D
Analyses of Rainfall Hydrology and Water Resources RG744 Institute of Space Technology October 04, 2013
MeanRainfall • Mean Annual Rainfall: determined by averaging the total rainfall of several consecutive years at a place • Mean Monthly Rainfall: by averaging the monthly total rainfall for several consecutive years
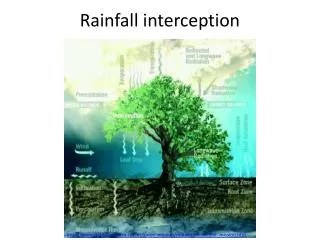
Interception and Net Precipitation • Vegetation influence on pattern of deposition and amount of precipitation reaching the soil surface • Interception losses are less in arid and semiarid regions that have sparse vegetation • Net precipitation is gross precipitation (measured by gauge) minus interception loss • Net precipitation is the amount available either to replenish soil water deficits or to become surface, subsurface, or ground water flow.
Effective Rainfall Rainfall component causing perceptible change in the stream flow That is only a portion of the total rainfall recorded over the catchment Rainfall that does not infiltrate the soil and moves into the stream as overland flow
Flood/Storm Frequency • Flood frequency: number of times a particular flood/storm can be expected in a river/watershed in a given number of years • Example: 100 year flood – a flood that can be expected once in 100 years. (usually worked out by extrapolating the observed data) • Frequency is the percentage of years, during which a storm of a given magnitude may be equaled or exceeded • Recurrence interval/return period: Time interval after which a similar flood can be forecasted or expected.
Frequency Analysis • Objective: to develop a frequency curve • Precipitation frequency curves can be developed to evaluate maximum events • Used for planning water resources structures • Relationship between the magnitude of events and either the associated probability or the recurrence interval • Weather systems vary year to year and hence magnitude of future events can not be predicted accurately • Have to rely on statistical analyses of rainfall amounts over certain period • Frequency distribution of past events • Probability or likelihood of having certain events occurring over a specified period is estimated
Recurrence Interval of a Storm • Number of years within which a given storm may equal or exceed once - Also known as return period • Means this precipitation value or more than that occurs m times in n years
Probability of Exceedance • The probability of occurrence of a flood (having a recurrence interval T-year) in any year, • Probability: Reciprocal of the return period p = 1/ T
Frequency • Frequency: Probability expressed in terms of percentage Frequency = p * 100 • Frequency of a rainfall of a given magnitude = the number of times the given event may be expected to be equaled or exceeded in 100 years
The probability of having a 24 hr rainfall event of 100mm or more in any given year is about 0.02 (or a 50 year recurrence interval)
Once the frequency curve is developed, the probability of exceeding certain rainfall amount over a specified period can be determined • The probability that an event with probability p will be equaled or exceeded x times in N years is determined by: • If x=0 (no occurrence in N years) then Prob (no occurrence in N years) = (1-p)N • Therefore; • Prob (at least 1 occurrence in N years) = 1-(1-p)N