Download
1 / 16
180 likes | 363 Views
Finance. Chapter 5 Risk & rates of return. No pain no gain. What is risk? How is risk measured? How can risk be minimized or at least compensated for bearing it? Investors like returns and dislike risk Investors will invest in risky assets only if they expect to receive higher returns.

E N D
Finance Chapter 5 Risk & rates of return
No pain no gain • What is risk? • How is risk measured? • How can risk be minimized or at least compensated for bearing it? • Investors like returns and dislike risk • Investors will invest in risky assets only if they expect to receive higher returns
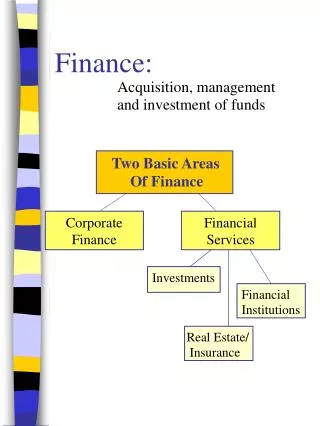
Risk in perspective • The riskiness of an asset can be considered in two ways: • Stand-alone—an assets cash flows are analyzed by themselves • Portfolio context—cash flows from a number of assets are combined (consolidated) and analyzed
Risk analysis considerations • Portfolio context • Diversifiable risk—risk that is eliminated through diversification (irrelevant) • Market risk—cannot be eliminated thru diversification (relevant) • An asset with a high degree of market risk (relevant) must provide a high rate of return to attract investors • Remember that investors are averse to risk
Investment returns • Measuring rates of return problem: • Scale (size of investment) • Timing problem • Solution: • Rates of return or percentage of return for a one year investment • ROR = (amount rec’d - amount invested) / amount invested
Stand-alone risk • Risk—the chance that some unfavorable event will occur • Stand-alone risk—the risk an investor would face if s/he held only one asset • Probability—the chance an event will occur • Probability distribution—a listing of all possible outcomes (events) with a chance of occurrence (probability) assigned to each outcome • Probabilities must add up to 100% • See Table 5-1, pg. 172
Expected rate of return • Expected rate of return, k (k-hat)—the rate of return expected to be realized from an investment; the weighted average of the probability distribution of possible results (payoff matrix)
Stand-alone risk • The tighter the probability distribution of expected future returns, the smaller the risk of a given investment (see figure 5-2, page 174) • Standard deviation (sigma)—the smaller the standard deviation, the tighter the probability distribution, and the lower the riskiness of a stock. • Standard deviation is essentially a weighted average of the deviations from the expected value.
Stand-alone risk • Coefficient of variation (CV)—the standard deviation divided by the expected return. • CV = Standardized measure of the risk per unit of return used for investments that have the same expected returns but different standard deviations.
Risk Aversion • Most investors are risk averse. • The higher a security’s risk the lower its price and the higher its required return. • Risk Premium (RP)—the difference between the expected rate of return on a given risky asset and that on a less risky investment = increased compensation required for a risky investment
Portfolio returns & risk • Expected return on a portfolio kp (k-hat p)= the weighted average of the expected returns on assets held in the portfolio • Realized rate of return k (k-bar) = the return that was actually earned during some past period. K-bar usually is different from the expected (k-hat) except for riskless assets.
Correlation coefficients • Correlation = the tendency of 2 variables to move together • Correlation coefficient, r = measures the degree of relationship between 2 variables (the tendency to correlate movements) • r can range from +1.0 (perfectly positive correlation - move up and down together) to -1.0 (perfectly negative correlation - move in opposite directions) while 0 means they are independent of one another. • Diversification means nothing if all stocks are perfectly correlated
Diversifiable risk vs. market risk • Almost half the riskiness of an average stock can be eliminated if the stock is held in a diversified portfolio containing at least 40 stocks • Market risk—that part of security’s risk that cannot be eliminated by diversification. • Capital Asset Pricing Model (CAPM)—a stock’s required ROR is equal to the risk-free rate of return plus a risk premium that reflects only the risk remaining after diversification. • Relevant risk—the risk remaining after diversification that cannot be diversified away (aka, market risk)
The concept of Beta (b) • Beta coefficient, b—a measure of market risk, which is the extend to which the returns on a given stock move with the stock market. • b measures the volatility of a stock, e.g., 1.0 (high beta)stocks will move up and down with the broad market averages. 0.5 (low beta) stocks are half as volatile as the market averages. A negative b means the stock will move in the opposite direction as the market average.
Market risk premium • RPm –the additional return over the risk-free rate needed to compensate investors for assuming an average amount of risk. • Security Market Line (SML)—the relationship between a security’s market risk and its required rate of return. The return required for any security is equal to the risk-free rate plus the market risk premium times the security’s beta:ki = krf + (km – krf )bi
Factors effecting RROR • Risk-free rate change (real rates or inflation) • Change in a stock’s beta • Investors’ aversion to risk can change • Global diversification may result in lower risk for multinational companies and globally diversified portfolios.