Download

1 / 20
240 likes | 559 Views
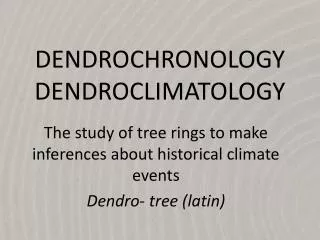
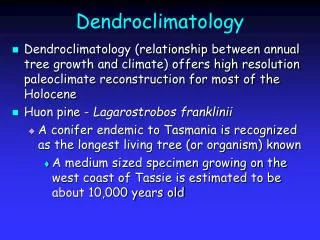
Dendroclimatology. Dendroclimatology. Dendroclimatologists are interested in past climate so that the variation and trend of modern climate can be put into perspective

E N D
Dendroclimatology Dendroclimatologists are interested in past climate so that the variation and trend of modern climate can be put into perspective Synoptic climatology – the study of climate from the perspective of atmospheric circulation – circulation patterns can be inferred from reconstructed patterns of precipitation, temp, and pressure Climate conditions can be estimated from a variety of natural environmental records going back to well before humans existed. Information of this kind is called “proxy data” because it substitutes for, or acts as a proxy for, the actual data we are seeking.
Dendroclimatology • Climate reconstruction starts with a site-level analysis of a tree species’ climate response • Site selection – trees chosen from sensitive sites • Many ages of trees chosen because trees may change in their climatic response with age • Older trees yield longer chronologies, but older trees may have a weakened climate signal due to senescence • Injured trees or those in the understory are avoided • Sample depth • - Standardization removes non-climatic trends
Dendroclimatology PRISM data- takes data from individual climate stations and modles the signal ofer the landscape based on a physiological model. This data set provides accurate climatological info for location not previously monitored Climate division data from National Climate Data Center
Correlation analysis • Correlation analysis complements results from response function analysis. • RFA primarily concerned with temp and precip. Correlation analysis can be done on ALL climate variables (PDSI, ENSO, PDO, etc.) • Correlation analysis best done with stats packages (SAS, Systat) or PRECON. • Range of values = -1.0 < r < +1.0 • Associated with each r-value is its p-value which tests for statistical significance. • In general, we want p-values less than 0.05, or p < 0.05. • As in response function analysis, we also analyze months from the previous growing season (why?). • As in response function analysis, we look for groupings of monthly variables to indicate seasonal response by trees.
Positive! Negative! Correlation analysis Graphical output from PRECON. Any value above +0.2 or below -0.2 is significant.
Note how response function analysis (top) and correlation analysis (bottom) are complementary (but different).
Correlation analysis • R-values also known as Pearson correlation coefficients • SAS output below: r-value (top), p-value (middle), n size (bottom) • How do you interpret negative correlations? Pearson Correlation Coefficients Prob > |r| under H0: Rho=0 Number of Observations lmayt ljunt ljult laugt lsept loctt lnovt -0.08019 -0.03131 -0.34233 -0.16914 -0.29516 -0.09849 -0.02712 0.4941 0.7897 0.0023 0.1414 0.0096 0.4071 0.8173 75 75 77 77 76 73 75
Reconstructed Climate Variables 1) Temperature Trends in reconstructed Northern Hemisphere temperatures.
Reconstructed Climate Variables 2) Precipitation Trends in reconstructed precipitation for the American Southwest.
Dendroclimatology Teleconnection – the interconnection of physical parameters over long distances Primary Variables: - Temperature (ave, min, max) - Precipitation (total) - Palmer Drought Severity Index (PDSI) - Palmer Hydrologic Drought Index (PHDI) Derived Variables: - El Nino Southern Oscillation (ENSO) - North Atlantic Oscillation (NAO) - Atlantic Multidecadal Oscillation (AMO) - Pacific Decadal Oscillation (PDO)
Pacific Decadal Oscillation • Discovered late 1990s by salmon fisheries experts • Long-lived El Niño-like pattern of Pacific climate variability • Operates on longer 20 to 30 year periods • Note when shifts occurred…
Pacific Decadal Oscillation Warm phase PDO Cool phase PDO
North Atlantic Oscillation • Large scale seesaw in atmospheric mass between the subtropical high and the polar low • Dominant mode of winter climate variability in the North Atlantic region ranging from central North America to Europe • Operates on 20 to 30 year periods • …