Download
1 / 7
70 likes | 75 Views
This text provides an overview of measuring instruments such as rulers, clocks, speedometers, thermometers, and bathroom scales. It explains how these instruments have scales, which can be analog or digital. The text also discusses the use of data tables and graphs for recording and estimating measurements. It includes examples and tips for estimating values from graphs.

E N D
How to Measure • Measuring instruments are common. • Ruler • Clock • Speedometer • Thermometer • Bathroom scale • All instruments have a scale. • Scale can be analog or digital • Instruments can have multiple scales
Analog Scales • Analog scales require interpolation and rounding • Rounding when a value is taken at the nearest tick mark • Interpolation when a value is estimated between two adjacent marks
Digital Scales • Digital scales give a direct numeric value. • Usually accurate to all digits in display. • Many provide an extra digit for rounding. • Calculators are not measuring devices. • They will give more figures than are significant. • Round to the correct number of significant figures
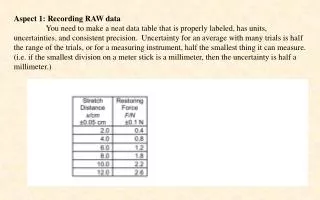
Data is often placed in tables. Columns should be labeled with measurement and units Values should have the correct significant figures Time (s)Height (m) 0.00 5.00 0.25 5.75 0.50 6.40 0.75 6.94 1.00 7.38 1.25 7.72 1.50 7.96 1.75 8.10 2.00 8.13 2.25 8.07 Data Tables
Graphs • Both a recording tool and measuring device • Keep track of measurements as they are recorded • Estimate measurements from data on the graph • Graphs have two scales
Estimating from Graphs • When is the speed equal to 23 m/s? • Find the 23 m/s value • Find the intersection(s) • Find the corresponding time(s)