Download
1 / 36
360 likes | 364 Views
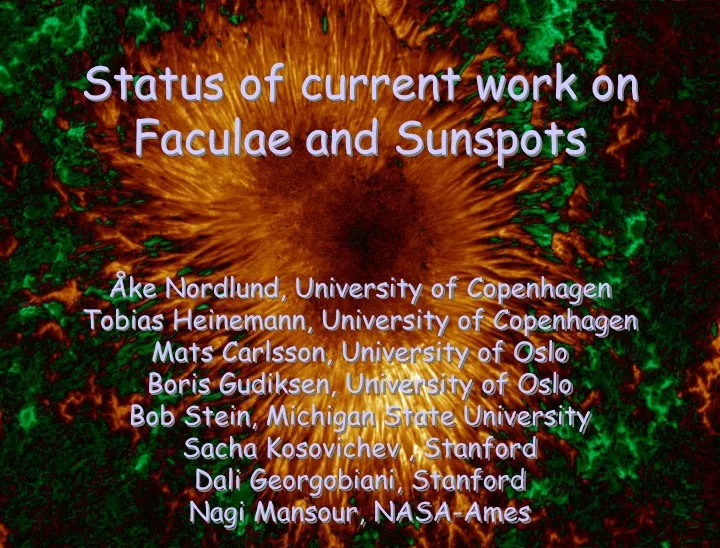
Status of current work on Faculae and Sunspots. Åke Nordlund, University of Copenhagen Tobias Heinemann, University of Copenhagen Mats Carlsson, University of Oslo Boris Gudiksen, University of Oslo Bob Stein, Michigan State University Sacha Kosovichev , Stanford

E N D
Status of current work onFaculae and Sunspots Åke Nordlund, University of Copenhagen Tobias Heinemann, University of Copenhagen Mats Carlsson, University of Oslo Boris Gudiksen, University of Oslo Bob Stein, Michigan State University Sacha Kosovichev , Stanford Dali Georgobiani, Stanford Nagi Mansour, NASA-Ames
Chromosphere Corona Sunspots Faculae 20 Mm 30 Mm 50 Mm Convection: from granulation to supergranulation scales Grand Plan
Today: Progress Report • Faculae • Center-to-limb behavior • Light bridges • Relation to pores, umbrae and penumbrae • Sunspots • Importance of resolution
Photospheric physics • Equation of state • Qualitative: H+He+Me • Accurate: Lookup table • Opacity • Qualitative: H-minus • Accurate: Lookup table; Opacity Distribution Function • Radiative energy transfer • Qualitative: Vertical & horizontal rays • Accurate: Comprehensive set of rays
Coronal physics • Equation of state • Qualitative: H+He+Me • Accurate: Lookup table • Heat conduction • Spitzer conductivity • Conduction parallel to B • Radiative cooling • Optically thin • Cooling functions from the litterature
Chromospheric physics • Equation of state • Qualitative or accurate • Energy fluxes • Spitzer heat conduction • Convective transport (driven) • Radiation; continuum and ke • Radiative cooling • Optically thick • Approximation of key spectral lines
Code: Staggered Mesh Code • Cell centered mass and thermal energy densities • Face-centered momenta and magnetic fields • Edge-centered electric fields and electric currents • Advantages: • simplicity; OpenMP (MPI btw boxes) • consistency (e.g., divB=0) • accuracy; conservative, 5th order
Radiative Transfer Equation • Solve in a form that directly gives the cooling
5 Rays Through Each Surface Grid Point Interpolate source function to rays at each height
Plage & Sunspot simulations • Dimensions: 12x12x3 Mm • Intermediate resolution: 250x250x125 • dx = 48 km, dz = 24 km • Duration ~ 60 min, production run • Higher resolution: 500x500x125 • dx = 24 km, dz = 24 km • Duration ~ 15 min, testing high res. effects • Target resolution: 1000x1000x250 • dx = 12 km, dz = 12 km • Duration ~ hours
Vertical magnetic field 250x250x125, duration ~ 35 min Average flux density slowly growing from 400 G to ~ 600 G 12 Mm -2 kG 2
Vertical slice, ~entropy Resolution 250x250x125 Duration ~ 35 min 3 Mm 12 Mm
High resolution (500x500x125) Vertical magnetic field Surface temperature Size: 12 Mm Resolution: 24 km
Sunspot lightbridges • Model, scale 1.5 x 1.5 x 3 Mm • resolution 12x12x12 km • with radiation and ionization
Sunspot lightbridges • Model, scale 1.5 x 1.5 x 3 Mm • resolution 12x12x12 km • with radiation and ionization
Faculae, continuum, G-band • Hot walls • Seen in projection • Evacuated foreground • G-band; molecule bands • Temperature sensitivity
Magnetic concentrations: cool, low r,low opacity.Towards limb,radiation emerges from hot granulewalls behind.On optical depth scale,magneticconcentrations are hot, contrast increases with opacity
Temperature structure: Granule (G) Intergranular lane (IG) G-band bright point (BP) Dark flux concentration (FC) *: T=Tgband +: T=Tgcont
Striated Bright Walls Observed Model
3-D simulations (Stein & Nordlund) V~k-1/3 MDI correlation tracking (Shine) MDI doppler (Hathaway) TRACE correlation tracking (Shine) V ~ k Solar velocity spectrum Velocity spectrum: v(k) = (k P(k))1/2
Velocity driving for corona sims Voronoi tessellation ensemble Velocity spectrum from three superposed ensembles
~Scale Free Spectrum?Doppler Image of the SunMichelson Doppler Interferometer (SOHO/MDI)
400 Mm 100 Mm 50 Mm 200 Mm Solar horizontal velocity (observed)Scales differ by factor 2 – which is which?
Solar horizontal velocity (model)Scales differ by factor 2 – which is which? 12 Mm 24 Mm 3 Mm 6 Mm
Supergranulation scale convection:first relax 24x24x9 Mm, then 50x50x20 Mm • Origin of supergranulation • Role of HeII ionization • Role of magnetic field • Emergence of magnetic flux • Maintenance of magnetic network • Driving coronal heating simulations Vertical velocity
Summary • High resolution, large resources needed • Faculae • Sunspots • Lightbridges; illusion! • Large scale convection • Approx. scale free horizontal motions!