Download
1 / 40
410 likes | 549 Views
Tyler Junior College. Physics & Astronomy Presents-. Lab 8 – Emission Spectra. Nature of Light. Christiaan Huygens 1629-1695 Dutch. Sir Issac Newton 1643-1727 British. Heinrich Hertz 1857-1894 German. Models of Light: Newton’s Corpuscular Theory. Photon. Corpuscular Refraction.

E N D
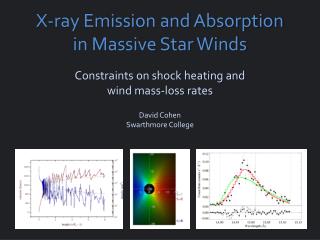
Tyler Junior College Physics & Astronomy Presents- Lab 8 – Emission Spectra
Nature of Light Christiaan Huygens 1629-1695 Dutch Sir Issac Newton 1643-1727 British Heinrich Hertz 1857-1894 German
Models of Light: Newton’sCorpuscular Theory Photon Corpuscular Refraction CorpuscularReflection
Models of Light: Huygens Wave Theory Wave Reflection Wave Refraction
Unified Theory of Light Photon
Nature of Light Dual Characteristics Newton Huygens Particle Wave Hertz BOTH! E=hf (photon)
Thermal Radiation Thermal Radiation-Emission of Radiation due to the internal temperature of an object. Any object that has a temperature above 0°K (Kelvin) emits radiation. Yes, even grass emits radiation. Temperature scales-measure average kinetic energy of an object. Fahrenheit (°F) Celsius (°C) Kelvin (°K)
Color Wavelength Light Waves Wavelength () Red Light – Longer Wavelength, Lower Energy Blue Light – Shorter Wavelength, Higher Energy
Kirchhoff’s Laws • 1. A hot, dense glowing object (a solid or dense gas) emits a continuous spectrum. • 2. A hot, low-density gas emits light of only certain wavelengths—a bright line spectrum. • 3. When light having a continuous spectrum passes through a cool gas, dark lines appear in the continuous spectrum.
Hydrogen Atom 5 4 -e 434 nm 3 2 656 nm -e 1 -e +P 486 nm 410 nm -e -e 4000 Å 7000 Å
How to Excite an Atom 1. Absorption of a Photon 4 3 4000 Å 7000 Å 2 White Light Source 1 +P 6563 Å Hydrogen Atom -e -e
Aluminum Argon Calcium Carbon Helium Hydrogen Iron Krypton Magnesium Neon Nitrogen Oxygen Sodium Sulfur Xenon
Diffraction Diffraction- is the dispersion of light by an transparent filter with tiny line etched into the filter.
Spectroscopy SPECTROSCOPY- Is the examination of the spectra (sing.) of a luminous object by refracting (bending) the light with a prism or passing light through a slit and onto a object with minute lines. SPECTROSCOPE (or Spectrometer)- Instrument that produces spectra and compares it to a standard. DIFFRATION GRATING-a slide with a plastic material that has very small lines cut into it. Light waves passing between the lines interferes with other light waves bending them. Also light passing through gases or water crystals.
Diffraction Grating Spectra Incandescent Light Line Diffraction Fluorescent Light
Spectroscope Diffraction Grating & Viewer Display scale in nm Slit Exterior Display
Application Experiment With Diffraction Grating and Spectroscope, examine the spectra of a: Incandescent Light Fluorescent Light Luminous gases Unknown gas
Luminous Gas Hydrogen Gas (H2) A gas that has electricity passing through it, will become luminous as its electrons lose electrical energy and “ fall back “ to lower energy levels as shown previously.
Using the Spectrophotometer Look into the Eye Piece. Look to the Right at the scale. Don’t look at the slit.
Using the Spectrophotometer Aim the slit at the light source and line up the slit and the source.
520nm 460nm 680nm 410nm 550nm 450nm 650nm 710nm 740nm 390nm 700nm 400nm 600nm 500nm 630nm 570nm Study This Slide Very Carefully!!!!!
Using the Spectrophotometer Notice the lines and the areas of color. Notice also the scale and the numbers. Blue line at 450 nm Blue Area between 450 nm line and 500 nm. Red Area between 610 nm and 650 nm. Green line at 575 nm Green Area to 610 nm
Determination of Energy in eV from wavelength ( λ )* • Wavelength (λ) in Angstroms ( Å ) or nm • Frequency ( f ) in /sec or Hz • Speed of Light (c) 2.99 X 10⁸ m/s • Convert Å or nm to meters • Divide speed of light by λ in meters f in /s • with f = c / λ • Multiply f times Planck’s Constant E in joules (j) • with E = hf • 4. Convert E in j to E in eV *YOU WILL GET THE eV FROM THE SPECTRA !
Example* • Blue light has a wavelength ≈ 4000 Å (400 nm) • 1. 4000 Å 1 m • 1 1010 Å • 2.99 X 10⁸ m/s • 4 X 10⁻⁷ m • E = h f = (6.63 X 10⁻³⁴ j · s) (7 X 10¹⁴ /s) = 5 X 10-19 j • 4. 5 X 10-19 j1eV • 1 1.60 X 10⁻¹⁹ j ● = 4 x 10⁻⁷m [Table 5] f = c/λ = = 7 X 10¹⁴ /s ● = 3 eV [Appendix A] *(Lab 6 Homework!)
The End Lab 8 Emission Spectra