Download
1 / 69
690 likes | 800 Views
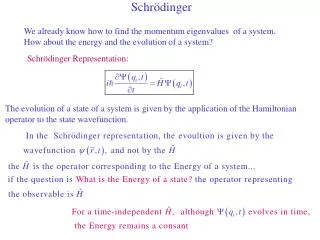
TAU Performace System: Developments and Evolution. Allen D. Malony , Sameer Shende, Robert Ansell-Bell {malony,sameer,bertie}@cs.uoregon.edu Computer & Information Science Department Computational Science Institute University of Oregon. Performance Needs Performance Technology.

E N D
TAU Performace System: Developments and Evolution Allen D. Malony, Sameer Shende, Robert Ansell-Bell {malony,sameer,bertie}@cs.uoregon.edu Computer & Information Science Department Computational Science Institute University of Oregon
Performance Needs Performance Technology • Observe/analyze/understand performance behavior • Multiple levels of software and hardware • Different types and detail of performance data • Alternative performance problem solving methods • Multiple targets of software and system application • Robust AND ubiquitous performance technology • Broad scope of performance observability • Flexible and configurable mechanisms • Technology integration and extension • Cross-platform portability • Open, layered, and modular framework architecture
Complexity Challenges • Computing system environment complexity • Observation integration and optimization • Access, accuracy, and granularity constraints • Diverse/specialized observation capabilities/technology • Restricted modes limit performance problem solving • Sophisticated software development environments • Programming paradigms and performance models • Performance data mapping to software abstractions • Uniformity of performance abstraction across platforms • Rich observation capabilities and flexible configuration • Common performance problem solving methods
General Problem How do we create robust and ubiquitous performance technology for the analysis and tuning of parallel and distributed software and systems in the presence of (evolving) complexity challenges?
Talk Outline • Computation Model for Performance Technology • TAU Performance Framework • Model-oriented framework architecture • TAU performance system toolkit • Flexibility and portability (SIMPLE example) • Recent Developments • Complexity scenarios • Mixed-mode performance analysis (OpenMP+MPI) • OpenMP performance API • Performance mapping and C-SAFE Uintah • TAU Evolution
Computation Model for Performance Technology • How to address dual performance technology goals? • Robust capabilities + widely available methodologies • Contend with problems of system diversity • Flexible tool composition/configuration/integration • Approaches • Restrict computation types / performance problems • limited performance technology coverage • Base technology on abstract computation model • general architecture and software execution features • map features/methods to existing complex system types • develop capabilities that can adapt and be optimized
Framework for Performance Problem Solving • Model-based composition • Instrumentation / measurement / execution models • performance observability constraints • performance data types and events • Analysis / presentation model • performance data processing • performance views and model mapping • Integration model • performance tool component configuration / integration • Can performance problem solving framework be designed based on general complex system model?
General Complex System Computation Model • Node:physically distinct shared memory machine • Message passing node interconnection network • Context: distinct virtual memory space within node • Thread: execution threads (user/system) in context Interconnection Network Inter-node messagecommunication * * Node Node Node node memory memory memory SMP physicalview VM space … modelview … Context Threads
TAU Performance Framework • Tuning and Analysis Utilities • Performance system framework for scalable parallel and distributed high-performance computing • Targets a general complex system computation model • nodes / contexts / threads • Multi-level: system / software / parallelism • Measurement and analysis abstraction • Integrated toolkit for performance instrumentation, measurement, analysis, and visualization • Portable performance profiling/tracing facility • Open software approach
TAU Instrumentation • Flexible, multiple instrumentation mechanisms • Source code • manual • automatic using PDT (tau_instrumentor) • Object code • pre-instrumented libraries • statically linked • dynamically linked • fast breakpoints • Executable code • dynamic instrumentation using DynInstAPI (tau_run)
TAU Instrumentation (continued) • Common target measurement interface (TAU API) • C++ (object-based) design and implementation • Macro-based, using constructor/destructor techniques • Function, classes, and templates • Uniquely identify functions and templates • name and type signature (name registration) • static object creates performance entry • dynamic object receives static object pointer • runtime type identification for template instantiations • C and Fortran instrumentation variants • Instrumentation and measurement optimization
TAU Measurement • Performance information • High resolution timer library (real-time / virtual clocks) • Generalized software counter library • Hardware performance counters • PCL (Performance Counter Library) (ZAM, Germany) • PAPI (Performance API) (UTK, Ptools Consortium) • consistent, portable API • Organization • Node, context, thread levels • Profile groups for collective events (runtime selective) • Mapping between software levels
TAU Measurement (continued) • Profiling • Function-level, block-level, statement-level • Supports user-defined events • TAU profile (function) database (PD) • Function callstack • Hardware counts instead of time • Tracing • Profile-level events • Interprocess communication events • Timestamp synchronization • User-controlled configuration (configure)
TAU Analysis • Profile analysis • Pprof • parallel profiler with texted based display • Racy • graphical interface to pprof • jRacy • Java implementation of Racy • Trace analysis • Trace merging and clock adjustment (if necessary) • Trace format conversion (ALOG, SDDF, PV, Vampir) • Vampir (Pallas)
Strategies for Empirical Performance Evaluation • Empirical performance evaluation as a series of performance experiments • Experiment trials describing instrumentation and measurement requirements • What/Where/How axes of empirical performance space • Strategies for achieving flexibility and portability goals • Limited performance methods restrict evaluation scope • Non-portable methods force use of different techniques • Integration and combination of strategies • SIMPLE hydrodynamics benchmark (C, MPI) • Multiple instrumentation methods • Alternatives analysis techniques
Multi-Level Instrumentation with Profiling • Source-based • PDT • MPI wrappers • MPI profiling library • Performance metrics • Time • Hardware counter
Dynamic Instrumentation • Uses DyninstAPI for runtime code patching • Mutator loads measurement library, instruments mutatee • one mutator per executable image [TAU, DynaProf] • one mutator for several executables [Paradyn, DPCL]
Performance Perturbation Study • Measurement alternatives • PAPI wallclock overhead 27% lower than gettimeofday system call under IA-32 Linux 2.x • Source vs. runtime instrumentation • source 23% lower than runtime for TAU profiling • Need to balance alternatives • Abstractions and instrumentation levels • Flexibility /simplicity • “Instrumentation and Measurement Strategies for Flexible and Portable Empirical Performance Evaluation”, PDPTA, June 2001.
Complexity Scenarios • Object-oriented programming and templates • Object-based performance analysis • Performance measurement of template-derived code • Array classes and expression transformation • Source code performance mapping • Multi-threaded and asynchronous execution • Abstract thread-based performance measurement • Multi-threaded parallel execution • Asynchronous runtime system scheduling • Parallel performance mapping
Complexity Scenarios (continued) • Virtual machine environments • Performance instrumentation in virtual machine • Measurement of multi-level virtual machine events • Mixed-mode parallel computation • Portable shared memory and message passing APIs • Performance measurement of message passing library • Integration with multi-threading • Hierarchical, hybrid parallel systems • Combined task and data parallel execution • Performance system configuration and model mapping
Multi-Threading Performance Measurement • General issues • Thread identity and per-thread data storage • Performance measurement support and synchronization • Fine-grained parallelism • different forms and levels of threading • greater need for efficient instrumentation • TAU general threading and measurement model • Common thread layer and measurement support • Interface to system specific libraries (reg, id, sync) • Target different thread systems with core functionality • Pthreads, Windows, Java, SMARTS, Tulip, OpenMP
Mixed-mode Parallel Programs (OpenMPI + MPI) • Portable mixed-mode parallel programming • Multi-threaded shared memory programming • Inter-node message passing • Performance measurement • Access to RTS and communication events • Associate communication and application events • 2D Stommel model of ocean circulation • OpenMP for shared memory parallel programming • MPI for cross-box message-based parallelism • Jacobi iteration, 5-point stencil • Timothy Kaiser (San Diego Supercomputing Center)
OpenMP + MPI Ocean Modeling (Trace) Threadmessagepairing IntegratedOpenMP +MPI events
OpenMP + MPI Ocean Modeling (HW Profile) % configure -papi=../packages/papi -openmp -c++=pgCC -cc=pgcc -mpiinc=../packages/mpich/include -mpilib=../packages/mpich/libo IntegratedOpenMP +MPI events FP instructions
Mixed-mode Parallel Programs (Java + MPI) • Multi-language applications and mixed-mode execution • Java threads and MPI • mpiJava (Syracuse, JavaGrande) • Java wrapper package with JNI C bindings to MPI • Integrate cross-language/system technology • JVMPI and Tau profiler agent • MPI profiling interface - link-time interposition library • Cross execution mode uniformity and consistency • invoke JVMPI control routines to control Java threads • access thread information and expose to MPI interface • “Integration and Application of the TAU Performance System in Parallel Java Environments,” ISCOPE, 2001.
Thread API TAU Java Instrumentation Architecture Java program mpiJava package TAU package JNI MPI profiling interface Event notification TAU TAU wrapper Native MPI library JVMPI Profile DB
Integrated event tracing Mergedtrace viz Nodeprocessgrouping Threadmessagepairing Vampirdisplay Multi-level event grouping Parallel Java Game of Life (Trace)
OMP Performance Tools Interface • Goal 1: Expose OpenMP events and execution states to a performance measurement system • What are the OpenMP events / states of interest? • What is the nature (mechanism) of the interface? • Goal 2: Make the performance measurement interface portable • “Standardize” on interface mechanism / semantics • Goal 3: Support source-level and compiler-level implementation of interface • “Towards a Performance Tools Interface for OpenMP: An Approach Based on Directive Rewriting,” EWOMP 2001.
Performance State and Event Model • Based on performance model for (nested) fork-join parallelism, multi-threaded work-sharing, and thread-based synchronization • Define with respect to multi-level state view • Level 1: serial and parallel states (with nesting) • Level 2: work-sharing states (per team thread) • Level 3: synchronization states (per team thread) • Level 4: runtime system (thread) states • Events reflect state transitions • State enter / exit (begin / end) • State graph with event edges
Fork-Join Execution States and Events Events masterslave Parallel region operation master starts serial execution X parallel region begins X S STARTUP slaves started X team begins parallel execution X X P team threads hit barrier X X slaves end; master exits barrier X X SHUTDOWN master resumes serial execution X S
Performance Measurement Model • Serial performance • Detect serial transition points • Standard events and statistics within serial regions • Time spent in serial execution • Locations of serial execution in program • Parallel performance • Detect parallel transitions points • Time spent in parallel execution • Region perspective and work-sharing perspective • Performance profiles kept per region • More complex parallel states of execution
Event Generation (Callback) Interface • Directive-specific callback functions • omperf_{NAME}_{TYPE}(D) • NAME is replaced by OMP directive name • TYPE is either fork/join, enter/exit, begin/end • D is a context (region) descriptor • Advantages • Standardizes function names independent of base programming language • Specification tied directly to programming model • Define addition OpenMP directives • Initialization, termination, measurement control
Instrumentation Alternatives • Source-level instrumentation • Manual instrumentation (will be done anyway) • Directive (source-to-source) transformation • Compiler instrumentation • More closely tied to directive processing • Could allow more efficient implementation • Runtime system instrumentation • RTL-level events • Possibly gain more detailed information • Dynamic instrumentation • May be very hard to do without well-defined interface
Proposal Based on Directive Transformation • Consider source-level approach • For each OMP directive, generate an “instrumented” version which calls the performance event API. • What is the event model for each directive? • Issues • OMP RTL execution behavior is not fully exposed • May not be able to generate equivalent form • Possible conflicts with directive optimization • May be less efficient • Hard to access RTL events and information • Proposed transformations (B. Mohr, Research Centre Juelich)
!$OMP PARALLELstructured block!$OMP END PARALLEL call omperf_parallel_fork(d)!$OMP PARALLELcall omperf_parallel_begin(d)structured blockcall omperf_barrier_enter(d)!$OMP BARRIERcall omperf_barrier_exit(d)call omperf_parallel_end(d)!$OMP END PARALLELcall omperf_parallel_join(d) !$OMP DOdo loop!$OMP END DO call omperf_do_enter(d)!$OMP DOdo loop!$OMP END DO NOWAITcall omperf_barrier_enter(d)!$OMP BARRIERcall omperf_barrier_exit(d)call omperf_do_exit(d) Parallel Region and Do Transformation
!$OMP WORKSHAREstructured block!$OMP END WORKSHARE call omperf_workshare_enter(d)!$OMP WORKSHAREstructured block!$OMP END WORKSHARE NOWAITcall omperf_barrier_enter(d)!$OMP BARRIERcall omperf_barrier_exit(d)call omperf_workshare_exit(d) !$OMP ATOMICatomic expression call omperf_atomic_enter(d)!$OMP ATOMICatomic expressioncall omperf_atomic_exit(d) !$OMP MASTERstructured block!$OMP END MASTER !$OMP MASTERcall omperf_master_begin(d)structured blockcall omperf_master_end(d)!$OMP END MASTER Worksharing, Atomic, and Master Transformation
!$OMP SECTIONS!$OMP SECTIONstructured block!$OMP SECTIONstructured block!$OMP END SECTIONS call omperf_sections_enter(d)!$OMP SECTIONS!$OMP SECTIONcall omperf_section_begin(d)structured blockcall omperf_section_end(d)!$OMP SECTIONcall omperf_section_begin(d)structured blockcall omperf_section_end(d)!$OMP END SECTIONS NOWAITcall omperf_barrier_enter(d)!$OMP BARRIERcall omperf_barrier_exit(d)call omperf_sections_exit(d) Sections and Section Transformation
!$OMP CRITICALstructured block!$OMP END CRITICAL call omperf_critical_enter(d)!$OMP CRITICALcall omperf_critical_begin(d)structured blockcall omperf_critical_end(d)!$OMP END CRITICALcall omperf_critical_exit(d) !$OMP BARRIER call omperf_barrier_enter(d)!$OMP BARRIERcall omperf_barrier_exit(d) !$OMP SINGLEstructured block!$OMP END SINGLE call omperf_single_enter(d)!$OMP SINGLEcall omperf_single_begin(d)structured blockcall omperf_single_end(d)!$OMP END SINGLE NOWAITcall omperf_barrier_enter(d)!$OMP BARRIERcall omperf_barrier_exit(d)call omperf_single_exit(d) Critical, Barrier, and Single Transformation
!$OMP PARALLEL DO clausesdo loop!$OMP END PARALLEL DO call omperf_parallel_fork(d)!$OMP PARALLEL other-clausescall omperf_parallel_begin(d)call omperf_do_enter(d) !$OMP DO schedule-clauses | ordered-clauses | lastprivate-clausesdo loop !$OMP END DO NOWAITcall omperf_barrier_enter(d)!$OMP BARRIERcall omperf_barrier_exit(d) call omperf_do_exit(d) call omperf_parallel_end(d) !$OMP END PARALLELcall omperf_parallel_join(d) Combined Parallel Do Directive Transformation
!$OMP PARALLEL SECTIONS clauses!$OMP SECTIONstructured block!$OMP END PARALLEL SECTIONS call omperf_parallel_fork(d)!$OMP PARALLEL other-clausescall omperf_parallel_begin(d) call omperf_sections_enter(d) !$OMP SECTIONS lastprivate-clauses !$OMP SECTIONcall omperf_section_begin(d)structured blockcall omperf_section_end(d) !$OMP END SECTIONSNOWAIT call omperf_barrier_enter(d)!$OMP BARRIERcall omperf_barrier_exit(d) call omperf_sections_exit(d) call omperf_parallel_end(d)!$OMP END PARALLELcall omperf_parallel_join(d) Combined Parallel Sections Transformation
!$OMP PARALLEL WORKSHARE clausesstructured block!$OMP END PARALLEL WORKSHARE call omperf_parallel_fork(d)!$OMP PARALLEL clausescall omperf_parallel_begin(d) call omperf_workshare_enter(d) !$OMP WORKSHAREstructured block !$OMP END WORKSHARENOWAITcall omperf_barrier_enter(d)!$OMP BARRIERcall omperf_barrier_exit(d) call omperf_workshare_exit(d) call omperf_parallel_end(d)!$OMP END PARALLELcall omperf_parallel_join(d) Combined Parallel Work-Sharing Transformation
Performance Measurement Directives • Support for user-defined events • !$OMP INST BEGIN (region name)arbitrary user code!$OMP INST END (region name) • Place at arbitrary points in program • Translated into corresponding omperf_begin()andomperf_end()calls • Measurement control • !$omp perf on/off • #pragma omp perf on/off • Place at “consistent” points in program • Translate by compiler into omperf_on/off()
Describing Execution Context • Describe different contexts through context descriptor typedef struct ompregdescr {char* name;char* sub_name;int num_sections;char* filename;int begin_line1, end_line1;int begin_lineN, end_lineN;WORD data[4];struct region_descr* next; }; • Generate context descriptors in global static memory: • Table of context descriptors
Prototype Implementation • OPARI (OpenMP Pragma And Region Instrumentor) • Bernd Mohr (Research Centre Juelich) • OMP directives and performance API directives • Source-to-source transformation to omperf calls • Full F77/F90 OMP 2.0, C/C++ OMP 1.0 • omperf library implementations • EXPERT (Mohr) • Automatic performance analysis (OpenMP, MPI, hybrid) • Call EPILOG trace routines for omperf events • TAU • Profiling and tracing (OpenMP, MPI, hybrid) • OPARI instrumentation
omperf_for_{enter,exit} (EXPERT, Mohr) • void omperf_for_enter(OMPRegDescr* r) { struct ElgRegion* e; if (! (e = (struct ElgRegion*)(r->data[0]))) e = ElgRegion_Init(r); elg_enter(e->rid);}void omperf_for_exit(OMPRegDescr* r) { elg_omp_collexit();}
omperf_for_{enter,exit} (TAU) • void omperf_for_enter(OMPRegDescr* r) {#ifdef TAU_OPENMP_REGION_VIEW TauStartOpenMPRegionTimer(r);#endif}void omperf_for_exit(OMPRegDescr* r) {#ifdef TAU_OPENMP_REGION_VIEW TauStopOpenMPRegionTimer(r);#endif} • Can also have contruct-based view
OpenMP + MPI REMO Code (OPARI+EXPERT) • Colors show percentage of CPU time Isolate property performanceto code region 50% lost to sequentialexecution or was used by idle threads
OpenMP + MPI REMO Code (OPARI+EXPERT) • Large barrier time in implicit barrier of parallel do • Different distribution across threads