Download
1 / 49
510 likes | 756 Views
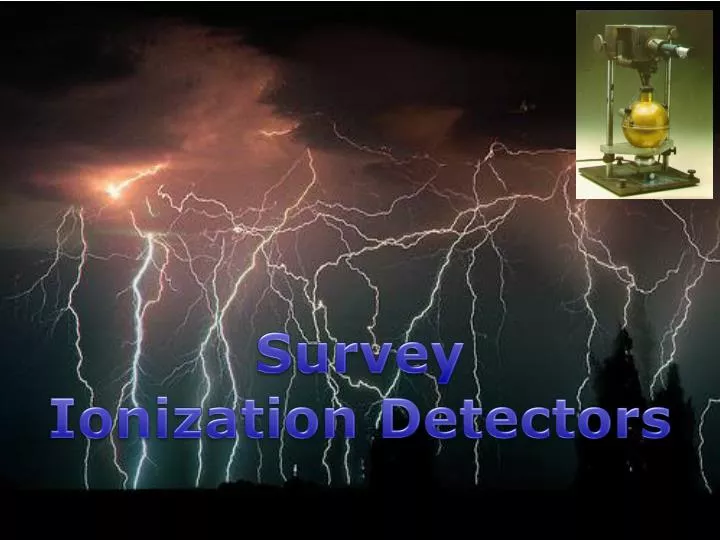
Survey Ionization Detectors. Atomic excitation ionization fluorescence phosphorescence. Dominant type of interaction: inelastic collisions with electrons. Main Interactions of Charged Particles. Collisions with nuclei :.

E N D
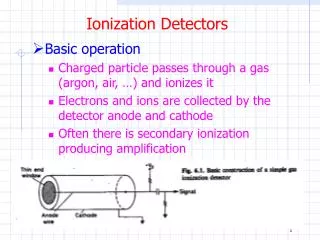
Atomic excitation ionization fluorescence phosphorescence Dominant type of interaction: inelastic collisions with electrons Main Interactions of Charged Particles Collisions with nuclei : Most interactions of charged particles with material components are collisions with atomic electrons. Nuclear collisions are noticeable only at low kinetic energies. W. Udo Schröder, 2012
Stochastic Multiple Scattering and Straggling U ions, 60 keV, straggling in range and angle Target of layers (“absorbers” Be, Au, Si) Range is diffuse: “Range straggling” Probability Range (Å) W. Udo Schröder, 2012
ds qs qs Probability Range (Å) Range and Stopping Power Scattering angle qspath variable s Stochastic multiple scattering process produces straggling in range, energy loss, angle Particles traversing an absorber attain broader energy spectrum Path length of trajectory Range Stopping power W. Udo Schröder, 2012
electron shell Zp, r dx dr Phenomenological Model Of Energy Loss in Matter Bethe et al. (1930-1953), Lindhardt’s electron theory Describes energy loss through ionization, incoming ions are fully stripped Estimate of trends/Order of magnitude E=particle kinetic energy, e- at rest W. Udo Schröder, 2012 Important only forces ⊥to trajectory, others cancel
electron shell Zp, r dx dr Phenomenological Model Of Energy Loss in Matter Integrate over radial coordinate: Estimate of radial limits: Ne = e- density le = electronic wave length, IE=ionization energy W. Udo Schröder, 2012
The Bethe-Bloch Formula Insert: r = atomic density, ZT = atomic number of target Ne = ZT ·r Example: energy loss in units of keV/(mg/cm2) W. Udo Schröder, 2012
Stopping Power Curves W. Udo Schröder, 2012 “mips” =minimum ionizing particles
Theoretical E-Loss in Thin Absorbers Units MeV/Nucleon Loss:MeV/A per mg/cm2 Bragg maximum Semi-quantitative only: Expt values smaller both at small and large energies recharging effects for projectile Mg He W. Udo Schröder, 2012
6600 ip/mm a a p 2750 ip/mm Range and Specific Ionization E-loss in Air: 1atm, 150C Stopping power dE/dx (specific energy loss) depends on energy E and therefore on x Bragg Curve Highest E loss close to end of path Bragg maximum Main E-loss mechanism: ionization, production of “delectrons,” electron-ion pairs W. Udo Schröder, 2012
Detector Design Principles Ionization Detectors Scintillation Detectors • Ionization chambers (gas and solid-state) • Proportional counters • Avalanche counters • Geiger-Müller counters • Cloud/bubble chambers • Track detectors • Phosphorescence counters • Fluorescence counters (inorganic solid crystal scintillators, organic solid and liquid scintillators) • Čherenkov counters Associated Techniques • Photo sensors and multipliers • Charged-coupled devices • Electronic pulse shape analysis • Processing/acquisition electronics W. Udo Schröder, 2012
P(x) P(x) P(x) t0 x E x x x l t1 >t0 t2 >t1 Driven Charge Transport in Gases Electric field E = D U/D x separates +/- charges (q=ne+, e-) Cycle: acceleration – scattering/ionizationDrift (w) and diffusion (D) depend on field strength Eand gas pressure p (or r). W. Udo Schröder, 2012
GAS ION µ+ (cm2 V-1 s+1) @STP Ar Ar+ 1.51 CH4 CH4+ 2.26 Ar+CH4 80+20 CH4+ 1.61 Ion Mobility Ion mobility m+ = w+/E Independent of field,for given gas at p,T=const. Analog for SSD: hole mobility Typical ion drift velocities(Ar+CH4 counters): w+ ~ (10-2 – 10-5) cm/ms ~(10-1000) m/s slow! E. McDaniel and E. Mason The mobility and diffusion of ions in gases (Wiley 1973) W. Udo Schröder, 2012
x - d x0 0 + DU(t) R Cs U0 Signal Generation in Ionization Counters Primary ionization: Gases I 20-30 eV/IP, Si: I 3.6 eV/IP Ge: I 3.0 eV/IP Band gaps (300K) 1.11 eV 0.67 eV Energy loss De:n= nI =ne= De /Inumber of primary ion pairs n at x0, t0 Force: Fe = -eU0/d = -FI Energy content of capacitor C: Capacitance C Signal W. Udo Schröder, 2012
DU(t) t0 te~ms tI~ms t Time-Dependent Signal Shape Total signal: e & I components Drift velocities (w+>0, w-<0) Both components measure De and depend on position of primary ion pairs x0 = w-(te-t0) RC time constant For fast counting use only electron component. W. Udo Schröder, 2012
If E field is strong enough, secondary electron-ion pairs through gas ionization Townsend Coefficient Avalanche Formation Electrons in outer shells are more readily removed, ionization energies are smaller for heavier elements.
signal C gas + - - + U0 counter gas IC and Amplification Counters Single-wire gas flow counter R Some counters are permanently sealed. Need reconditioning from time to time. W. Udo Schröder, 2012
DE(channels) Eresidual (channels) IC Performance ICs have excellent resolution in E, Z, A of charged particles but are “slow” detectors.Gas IC need very stable HV and gas handling systems. Energy resolution F<1 Fano factor W. Udo Schröder, 2012
+ + n - c p + DU(t) R E U0 EF + - Solid-State IC Solids have larger density higher stopping power dE/dx more ion pairs, better resolution, smaller detectors (also more damage and little regeneration max accumulated dose ~ 1023 particles i Semiconductor n-, p-, i- types Si, Ge, GaAs,.. (for e-,lcp, g, HI) Band structure of solids: Conduction e- Ionization lifts e- up to conduction band free charge carriers, produce D U(t). h+ Valence Bias voltage U0 creates charge-depleted zone W. Udo Schröder, 2012
e Conduction Band e- eC eF eG eV h+ Valence Band Particles and Holes in Semi-Conductors Fermi gas of electrons (and holes) Fermion statistics: 0 Small gaps eG (Ge) high thermal currents.Reduce by cooling. W. Udo Schröder, 2012
Donor Acceptor ions n p e- Si Bloc h+ o o o o o o o o o o o o o o o o o o o o o o o o o o o o o o o o o o o o - - - - - - - - - - - - - - - - - - - - - - - - + + + + + + + + + + + + + + + + + + + + + + + + space charge e- Potential o o o o o o o o o o o o d Semiconductor Junctions and Barriers Need detector with no free carriers.Si: i-type (intrinsic),n-type, p-type by diffusing Li, e- donor (P, Sb, As), or acceptor ions into Si.Trick: Increase effective gap Junctions diffuse donors and acceptors into Si bloc from different ends. Diffusion at interface e-/h+ annihilation space charge • Contact Potential and zone depleted of free charge carriers • Depletion zone can be increased by applying “reverse bias” potential Similar: Homogeneous n(p)-type Si with reverse bias U0 also creates carrier-free space dn,p:up to 1mm possible. W. Udo Schröder, 2012
Junction CB Semi conductor Insulation Metal film Silicon wafer Metal EF Metal case VB Connector Insulating Mount depleteddead layer Ground+BiasFront: Au Back: Alevaporated electrodes Surface Barrier Detectors Different Fermi energies adjust to on contact. Thin metal film on Si surface produces space charge, an effective barrier (contact potential) and depleted zone free of carriers. Apply reverse bias to increase depletion depth. ORTEC HI detector Possible: electrical depletion depth ~ 100mdead layer dd≤1mV ~ 0.5V/mOver-bias reduces dd W. Udo Schröder, 2012
Si-Strip Detectors Typically (300-500)m thick. Fully depleted, thin dead layer. Annular: 16 bins (“strips”) in polar (q) , 4 in azimuth (f) (Micron Ltd.) 5 cm circuit board Rectangular with 7 strips W. Udo Schröder, 2012
Ge g-ray Detectors Ge detectors for g-rays use p-i-n Ge junctions. Because of small gap EG, cool to -77oC (LN2) Ge Cryostate (Canberra) Ge cryostate geometries (Canberra) W. Udo Schröder, 2012
Properties of Ge Detectors: Energy Resolution Superior energy resolution, compared to NaI DEg ~ 0.5keV @ Eg =100keV Size=dependent mall detection efficiencies of Ge detectors 10% solution: bundle in 4p-arrays GammaSphere,Greta EuroGam, Tessa,… W. Udo Schröder, 2012
The End W. Udo Schröder, 2012
gas Rc signal + - C R - U0 + RI RA eUIRI Anode Wire e- q+ Proportional Counter Anode wire: small radius RA ≈ 50 mm or less Voltage U0 ≈ (300-500) V counter gas Avalanche RI RA, several mean free paths needed Pulse height mainly due to positive ions (q+) W. Udo Schröder, 2012
t DU t C DU R Pulse Shape event 1 event 2 event 4 event 1 long decay time of pulse pulse pile up, summary information differentiate electronically, RC-circuitry in shaping amplifier, individual information for each event (= incoming particle) event 2 event 4 DU W. Udo Schröder, 2012
Charge Collection Efficiency High ionization density at low electric fields: Edeposit > EappLower apparent energy due to charge recombination, trapping. Low ionization density (or high electric fields): Edeposit EappTypical charge collection times: t ~ (10-30)ns Moulton et al. Affects charge collection time signal rise time.Exploit for A, Z identification W. Udo Schröder, 2012
isobutane 50T DE x Bragg-Curve Sampling Counters Sampling Ion Chamber with divided anode DE1DE2 Eresidual Anodes Sample Bragg energy-loss curve at different points along the particle trajectory improves particle identification. W. Udo Schröder, 2012
_ Radiation U0 Non-linear Region d M +U0~kV/cm IC Region I U0 Townsend Gas Avalanche Amplification Amplification M W. Udo Schröder, 2012
cathode - sensitive layer d~1/a e- anode + R + ff ff PPAC PPAC U p Parallel Plate Counters: t-Resolution Charges produced at different positions along the particle track are differently amplified. non-linearity nip(DE) PPACs for good time resolution, U(p,f)f W. Udo Schröder, 2012
in Argon Avalanche Quenching A. Sharma and F. Sauli, Nucl. Instr. and Meth. A334(1993)420 Reduce l and energy of ions by collisions with complex organic molecules (CH4, …). Excitation of rotations and vibrations already at low ion energies Organic vapors = “self quenching” CH4 W. Udo Schröder, 2012
dac Cathode Wire Planes s d Anode Wires Equipotential Lines Anode Wires Multi-Wire Proportional Counters (Charpak 1968-80) Important for detection of high-energy particles, beam profile,.. Magic Gas: Ar(75%), iso-butane (24.5%), freon (0.5%) HV:kV/cm Field strength close to anode wires:V(x,y) 1/r W. Udo Schröder, 2012
y x Position-Sensitive Semiconductor Detectors Gerber et al., IEEE TNS-24,182(1977) Double-sided x/y matrix detector, resistive readout. R R Au Q n-Si R R ~2000 Wcm, 300mU0160V W. Udo Schröder, 2012
x cathode d x0 dFG 0 Anode/FG signals out Frisch Grid Ion Chambers Suppress position dependence of signal amplitude by shielding charge-collecting electrode from primary ionization track. Insert wire mesh (Frisch grid) at position xFG held constant potential UFG. e- produce signal only when inside sensitive anode-FG volume, ions are not “seen”. not x dependent. x-dependence used in “drift chambers”. particle W. Udo Schröder, 2012
q+ U conducting electrodes q+ t e+ R q+ Electronics Electronics: Charge Transport in Capacitors Simple charge motion, no secondary ionization/amplification Charges q+ moving between parallel conducting plates of a capacitor induce t-dependent negative images q+on each plate. Connected to circuitry, current of e- from negative electrode is proportional to charge q+. W. Udo Schröder, 2012
Electron Transport Multiple scattering/acceleration produces effective spectrum P(e) calculate effective land t: Simulations w- ~ 103 w+ Electron Transport: Frost et al., PR 127(1962)1621 V. Palladino et al., NIM 128(1975)323 G. Shultz et al., NIM 151(1978)413 S. Biagi, NIM A283(1989)716 http://consult.cern.ch/writeup/garfield/examples/gas/trans2000.html#elec W. Udo Schröder, 2012
Stability and Resolution • Anisotropic diffusion in electric field (Dperp >Dpar). • Electron capture by electro+negative gases, reduces energy resolution • T dependence of drift: Dw/w DT/T ~ 10-3 • p dependence of drift: Dw/w Dp/p ~ 10-3-10-2 • Increasing E fields charge multiplication/secondary+ ionization loss of resolution and linearity Townsend avalanches W. Udo Schröder, 2012
P(x) P(x) P(x) t0 x x x t1 >t0 t2 >t1 Free Charge Transport in Matter 1D Diffusion equation P(x)=(1/N0)dN/dx D diffusion coefficient, <v> mean speed lmean free path Thermal velocities : Maxwell+Boltzmann velocity distribution Small ion mobility W. Udo Schröder, 2012
Survey: Radiation Detectors
- V + Solid-State Gamma Detectors W. Udo Schröder, 2012
Literature/Tutorials James Ziegler W. Udo Schröder, 2012
Stopping and Range Tables for Charged Particles J.F. Ziegler (IBM&J.P. Biersack (HMI)) http://www.srim.org Older Literature: Hubert et al., Ann. De Physique Suppl.5, 1 (1980) W. Udo Schröder, 2012
Stopping Power Isotopic Scaling Laws Describes well the difference of R for different isotopes of a given element, but: W. Udo Schröder, 2012 R(Be)/R(Ar)=2.97 expt 4.67 theo Zeff ŧ Zp effective charge
Theory and Practice for Very Heavy Ions Theoretical energy loss in material of finite thickness is obtained from integration of the Bethe-Bloch formula or equivalent. Actual data may differ: Calibration required Energy lost by various ions in a 15.9 mm Si transmission detector vs. ion energy per nucleon (mass number A). Curves represent different theories. W. Udo Schröder, 2012
Helium Xenon Argon CH DME GAS (STP) 4 3.9 1.5 6.7 0.32 dE/dx ( keV / cm ) 2.4 6 ) n (ion pairs/ 16 55 cm 44 25 I+(h+) e- thickness GAS (STP) 1 mm 45 Helium 70 2 mm 1 mm 91.8 Argon 99.3 2 mm Primary Ionization Track (Gases) incoming particle ionization track n ion(hole)/e- pairs Minimum-ionizing particles(Sauli. IEEE+NSS 2002)Different counting gases Statistical ionization process: Poisson statisticsMaximum detection efficiency e depends on average number <n> of ion pairs DE nLinear Higher e for slower particles (Bragg curve) W. Udo Schröder, 2012
Effective Ionization Energies Mean energy per ion pair larger than IP because of excitations Large organic molecules have low-lying excited rotational states excitation without ionization through collisions =“quenching” additives W. Udo Schröder, 2012
a/p g + - Sparking and Spark Counters Impact ionization Probability g Different cathode materials d Prevent spark by reducing l for ions: collisions with large organic molecules quenching additives, self-quenching gases W. Udo Schröder, 2012