Download
1 / 11
110 likes | 235 Views
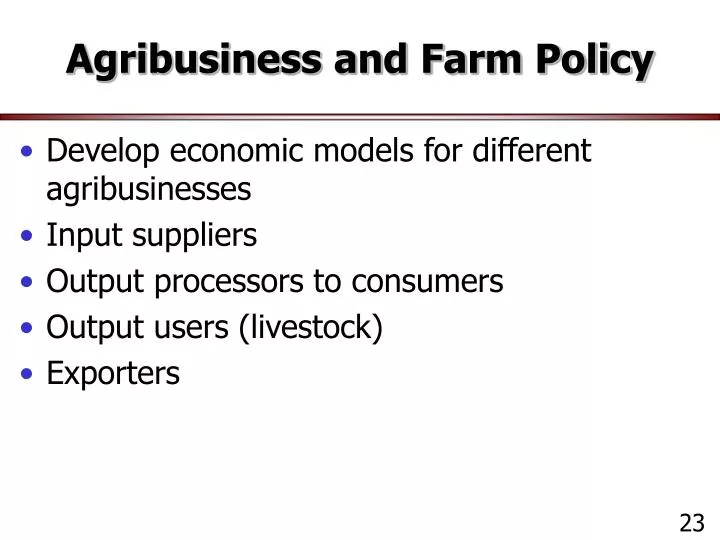
Agribusiness and Farm Policy. Develop economic models for different agribusinesses Input suppliers Output processors to consumers Output users (livestock) Exporters. 23. Agribusiness Cost Structure. Costs functions are characterized by flat AVC and MC

E N D
Agribusiness and Farm Policy • Develop economic models for different agribusinesses • Input suppliers • Output processors to consumers • Output users (livestock) • Exporters 23
Agribusiness Cost Structure • Costs functions are characterized by flat AVC and MC • Profits very sensitive to price of output and volume Price MC AVC MR Qt year
Agribusiness with Demand • Demand for Ag. Inputs is based on MVP fro the input • MVPinput = Price Output * MPPinput Price MC AVC P1 P0 MVP1 Qt year MVP0
PY S1 ARP and Input Suppliers’ Profits S0 PY1 PY0 Y crop output Y 45o line QY0 QY1 QX1 QX0 X Qt. Input Use PX QY1 QY0 S0 Demand X0 X Qt. Input Sold Y crop output Y crop output
PY S1 Mkt Loan and TP on Input Suppliers’ Profits MLR or TP PY0 PY1 Y crop output Y 45o line QY1 QY0 QX0 QX1 X Qt. Input Use PX QY0 QY1 MC Demand X1 Demand X0 X Qt. Input Sold Y crop output Y crop output
Price at Retail PR0 MC Mkt. Services Price at Farm Level S0 PF0 Derived Demand at Farm Level Qt0 ARP and impact on consumers prices D at Retail Qt at Retail S1 Qt at Farm
Price at Retail PR0 MC Mkt. Services Price at Farm Level S0 PF0 Derived Demand at Farm Level Qt0 ARP and impact on consumers prices D at Retail Qt at Retail Qt at Farm
Price at Retail PR0 MC Mkt. Services Price at Farm Level S0 PF0 Derived Demand at Farm Level Qt0 Mkt Loan and TP impact on consumers prices PR1 D at Retail Qt at Retail ML or TP PF1 Qt at Farm
Exporter Cost Structure • Costs functions are characterized by flat MC • Profits very sensitive to quantity exported • Usually work on aset margin per unit • Cut costs by type of transportation Price/Unit MR MC Qt Qt grain per year
Domestic Supply Excess Supply Domestic Supply TP or MLR Price0 World Price0 Price1 World Price1 Demand Exports Domestic Demand Qt per Year Qt Traded QS0 QS1 Qt Export0 Qt Export1 Impact of TP or Mkt Loan on Quantity of Exports
Domestic Supply Excess Supply Price0 World Price0 Demand Exports Domestic Demand Qt per Year Qt Traded QS1 QS0 Qt Export0 Impact of ARP on Quantity of Exports