Download
1 / 67
680 likes | 871 Views
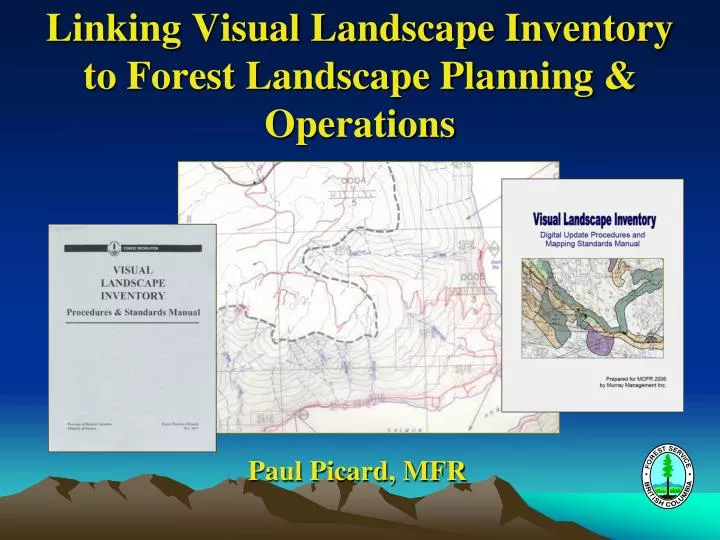
Linking Visual Landscape Inventory to Forest Landscape Planning & Operations. Paul Picard, MFR. Lecture outline. Overview of VLI & examples of uses in design Beyond VLI: rvqc, EVQOs, etc. How VLI information is accessed online. Other VLI uses: in Timber Supply Analyses, planning, etc

E N D
Linking Visual Landscape Inventoryto Forest Landscape Planning & Operations Paul Picard, MFR
Lecture outline • Overview of VLI & examples of uses in design • Beyond VLI: rvqc, EVQOs, etc. • How VLI information is accessed online. • Other VLI uses: in Timber Supply Analyses, planning, etc • Visual values monitoring in FRPA: C&E, FPB, Effectiveness Evaluations. 2
A 0005 PR M/H/H/H 3 A VLI - What is it? It is the identification, classification and recording of visual values on maps. The visible landscape is physically mapped, it is assessed using 35 factors and rated for its visual sensitivity to forest alterations and assigned a Visual Sensitivity Class between 1 and 5. 3
Mapping is completed from public use areas, communities, roads, water routes, trails etc. Identifies what’s visible and not visible. Delineates landscape into Visual Sensitivity Units (VSUs). Records particulars of each Visual Sensitivity Unit. Existing Visual Condition (EVC) Visual Absorption Capability (VAC) Biophysical Rating (BR) Viewing Condition (VC) Viewer Rating (VR) Classifies the VSU into one of five Visual Sensitivity Classes (VSC). 1. VLI in Review 4
Identifies the existing level of human made alterations on the landscape at the time the inventory is conducted. The terminology used is the same as for VQOs except that it has one more Class (Excessive Modification). Existing Visual Condition (EVC): 5
Shows how much “room to manoeuvre” is left on the landscape Example of EVC use in design/planning EVC = PR VQO = M vs PR 6
Shows how much “room to manoeuvre” is left on the landscape Example of EVC use in design/planning EVC = M VQO = M vs R 7
Rates the relative capacity of the landscape to absorb human made alterations and still maintain some visual integrity. The scale is high, medium, low. The higher the rating the more ability to absorb alteration. Visual Absorption Capability (VAC): 8
Hints as to which harvesting pattern may work & which may not work as easily Example of VAC use in design/planning VAC = Low Clearcutting will be harder to fit in than thinning or partial cutting 9
Hints as to which harvesting pattern may work & which may not work as easily Example of VAC use in design/planning VAC = High Clearcutting or small patches are likely to fit in & blend in very well 10
Identifies the degree of visual interest in the landscape and rates the level that it would attract viewer attention. The scale is high, medium low. The higher the attraction, the more sensitive it is. Biophysical Rating (BR): 11
Hints as to how spectacular the landscape is Example of BR use in design/planning BR = High Spectacular landscapes will be more challenging to design
Hints as to how spectacular the landscape is Example of BR use in design/planning BR = Low Less spectacular landscapes will be less challenging to design
Records the conditions under which the landscape is viewed such as viewing duration and number of viewpoints. The scale is high, medium & low. The higher the rating the more you see the landscape and the more sensitive it is. Viewing Condition (VC): 14
Hints as to how the landscape is viewed Example of VC use in design/planning VC = High Highly visible landscapes will be more challenging to design 15
Hints as to how the landscape is viewed Example of VC use in design/planning VC = Moderate Landscapes viewed in less prominent ways will be less challenging to design 16
Measures the number of people and their expectations for visual quality. Ratings are high, medium & low. The higher the rating the more people view the landscape and/or are more concerned. Viewer Rating (VR): 17
Indicates viewer expectations & numbers of viewers Example of VR use in design/planning VR = High Landscapes with large number of viewers & high expectations will be more challenging to design
Example of VR use in design/planning Indicates viewer expectations & numbers of viewers VR = Low Landscapes with small number of viewers & lower expectations will be less challenging to design
Rates the sensitivity of the landscape to visual alteration based on the Biophysical, and Viewing characteristics described previously. The rating scale is 1 to 5. Visual Sensitivity Class (VSC) : Class 5 has a very low sensitivity to alteration. Class 1 is very high sensitivity to alteration. 20
Meares Island, Tofino. A spectacular and very attractive landscape. Viewed and photographed by hundreds of thousands of people per year from Tofino. High biophysical rating, low VAC. This is an example of a regional feature and top end VSC-1 Example of VSC 1 21
Mountain along the Tuchodi River Another spectacular, attractive mountain. Unlike Meares Island this peak is in a remote area where viewer numbers are low. VAC is moderate. The area is used mainly by ATV riding hunting and fishing. Example of VSC 2 22
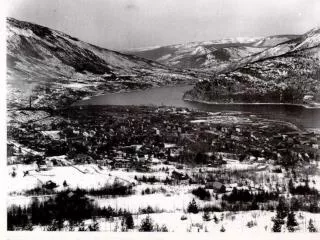
Hillside above Shuswap Lake. The VSU has a moderate biophysical rating Viewing is from Highway 1 for a short time at an oblique angle. Expectations are lower because of existing alterations in the scene and the similarity of the adjacent scenery. Example of VSC 3 A 23
An uninteresting VSU in the middleground. It has a moderate to low biophysical rating and moderate VAC. It is viewed infrequently from a secondary road and from a farm. Example of VSC 4 24
An uninteresting VSU in the mid ground. It has a low biophysical rating and medium VAC. Infrequent and short term viewing opportunities from a gravel road with low traffic numbers. Example of VSC 5 25
Polygon No. Visual Absorption Capability Existing Visual Condition Viewing Condition: Biophysical Rating Viewing Rating Visual Sensitivity Class 2. Understanding the Label When the Inventory mapping is complete a map label is applied to each polygon. 26
Beyond VLI: rvqc In VLI, the VSC is expressed as a rvqc, which is then taken into consideration in the establishement of scenic areas & VQOs. Management decisions (scenic areas & VQOs are also stored within the VLI database available online 28
4. How VLI information is accessed online VLI stored as shape files on the Land & Resource Data Warehouse (LRDW) Via the Recreation Resource Inventory Online Via www.lrdw.ca Via IMAP or IMFapp 29