Download
1 / 14
140 likes | 287 Views
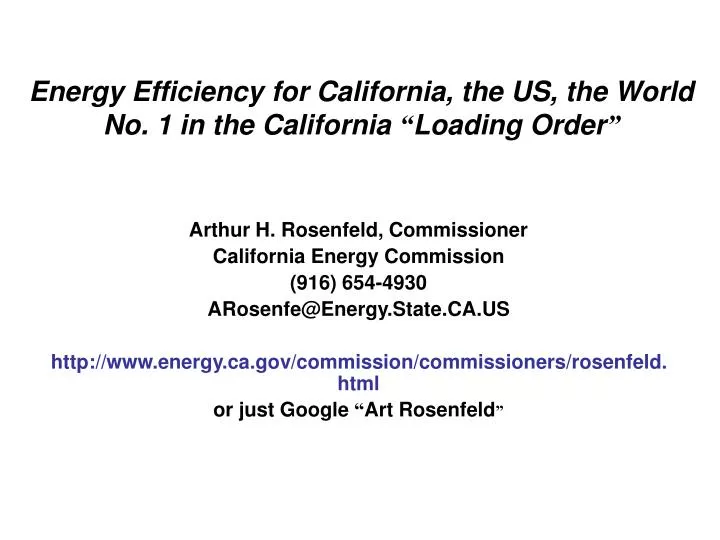
Energy Efficiency for California, the US, the World No. 1 in the California “ Loading Order ”. Arthur H. Rosenfeld, Commissioner California Energy Commission (916) 654-4930 ARosenfe@Energy.State.CA.US http://www.energy.ca.gov/commission/commissioners/rosenfeld.html

E N D
Energy Efficiency for California, the US, the WorldNo. 1 in the California “Loading Order” Arthur H. Rosenfeld, Commissioner California Energy Commission (916) 654-4930 ARosenfe@Energy.State.CA.US http://www.energy.ca.gov/commission/commissioners/rosenfeld.html or just Google “Art Rosenfeld”
Energy Intensity (E/GDP) in the United States (1949 - 2005) and France (1980 - 2003) 25.0 20.0 If intensity dropped at pre-1973 rate of 0.4%/year 12% of GDP = $1.7 Trillion 15.0 thousand Btu/$ (in $2000) Actual (E/GDP drops 2.1%/year) 10.0 7% of GDP = $1.0 Trillion France 5.0 0.0 1949 1953 1957 1961 1965 1969 1973 1977 1981 1985 1989 1993 1997 2001 2005
McKinsey Quarterly http://www.mckinseyquarterly.com/Energy_Resources_Materials/ A_cost_curve_for_greenhouse_gas_reduction_abstract
CO2 Conservation Supply Curves Explained Start with conservation & supply curves for electricity or natural gas Net benefit = annual saved bills – annualized first cost of measure (of course saved bills depends on price of electricity). Then convert kWh or therms to CO2 See NAS “Policy Implications of Greenhouse Warming” 1992, App. B • Policy Implications of Greenhouse Warming: • Policy Implications of Greenhouse Warming: Mitigation, Adaptation, and the Science Base (1992) Committee on Science, Engineering, and Public Policy (COSEPUP ...books.nap.edu/books/0309043867/html - 42k - Cached - Similar pages
Comparison of 3 Gorges to Refrigerator and AC Efficiency Improvements TWh Wholesale (3 Gorges) at 3.6 c/kWh Retail (AC + Ref) at 7.2 c/kWh Value of TWh 三峡电量与电冰箱、空调能效对比 120 7.5 100 If Energy Star Air Conditioners 空调 80 6.0 2005 Stds Air Conditioners 空调 TWH/Year Value (billion $/year) 2000 Stds 60 4.5 If Energy Star 3.0 40 Savings calculated 10 years after standard takes effect. Calculations provided by David Fridley, LBNL 2005 Stds Refrigerators 冰箱 20 1.5 2000 Stds 0 3 Gorges 三峡 Refrigerators 冰箱 3 Gorges 三峡 标准生效后,10年节约电量
Based Upon Exhibit 11: Updated Estimates for 2020 for the Climate Strategies Included in the 2006 CAT Report UPDATED MACROECONOMIC ANALYSIS OF CLIMATE STRATEGIES …