Download
1 / 20
200 likes | 320 Views
Degree Holders in Scotland’s Labour Market and the Impact of the Recession. Workshop 1 Lifelong Learning Statistics User’s Conference (March 2010). Available Statistics. Destinations of Leavers from Higher Education (Latest Statistics Publication available from -)

E N D
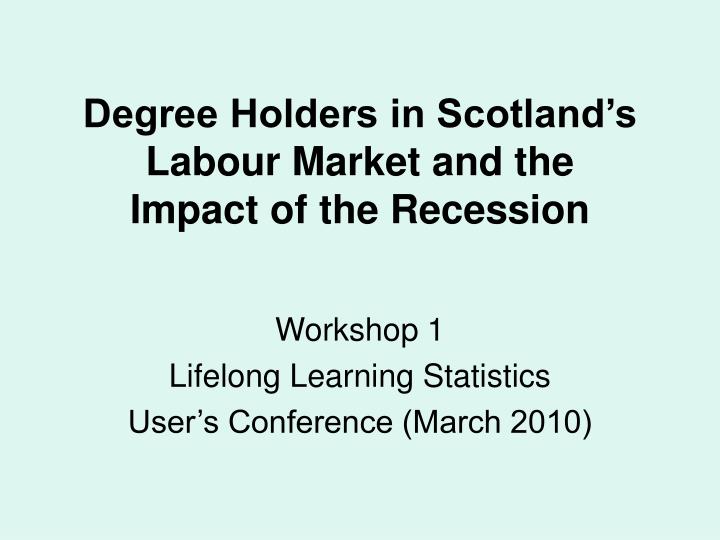
Degree Holders in Scotland’s Labour Market and the Impact of the Recession Workshop 1 Lifelong Learning Statistics User’s Conference (March 2010)
Available Statistics Destinations of Leavers from Higher Education (Latest Statistics Publication available from -) http://scotland.gov.uk/Publications/2009/12/10091627/0 Data Collected by Higher Education Statistics Agency (HESA). For more information please see -http://www.hesa.ac.uk/index.php/content/view/143/173/ Annual Updates produced on 6-month destinations. A longitudinal survey (based on 3.5 year destinations) is also run, though less frequently
Available Statistics • Latest results are for the 2007/08 Academic Year – the first leavers to be surveyed during the recession (January 2009) • Main Destinations for leavers from Scottish Higher Education Institutions (HEIs) were – Permanent UK Employment - 56.3% (↓ 3.3 percentage points) Further Study / Training - 18.9% (↑ 1.4 percentage points) Temporary UK Employment - 10.5% (↑ 1.0 percentage point) Believed Unemployed - 4.9% (↑ 1.2 percentage points)
Available Statistics • Next results (for 2008/09 leavers) due this Summer (Headlines by HESA, followed by more detailed analysis in September) • DLHE has many positive attributes, including its near universal coverage of leavers (its more like a census than a survey) and the level of detail it can provide by different demographics, institutions and subject groups • Potential disadvantages of DLHE include – • 1. The Time Lag between the ‘event’ and publication • 2. The narrow focus on 1 year’s worth of leavers • 3. Is 6-months enough time to properly assess destinations?
Available Statistics • To supplement DLHE, other sources of statistics have been investigated. • Labour Force Survey (LFS) and the Annual Population Survey (APS) • Claimant Count Statistics (JCP) • Quarterly Employee Jobs Estimates • Public Sector Employment Statistics • Data from this work can be viewed on our web-pages • http://www.scotland.gov.uk/Topics/Statistics/Browse/Lifelong-learning/Datasets
Building on DLHE, what do these sources suggest about destinations for degree-holders? • What has been the impact of the recession? • Where might we look to see evidence of a change in fortunes?
1. Degree Holders are a growing force in Scotland’s Labour Market Source: Labour Force Survey
2. The proportion of Working Age Population made up of Degree Holders varies by council Source: Annual Population Survey 2008
3. The employment rate of working-age degree-holders in Scotland is much higher than for those without and continues to hold up far better Source: Labour Force Survey
4. The unemployment rate of working-age degree-holders in Scotland is much lower than for those without and has seen a smaller increase Source: Labour Force Survey
5. Whilst employment rate remains high for degree-holders, the data suggests some shift from graduate to non-graduate level occupations. Further updates will be required before any clear trend is detected Source: Labour Force Survey
6. The most up-to-date available data is from the Claimant Count. A moving average can be used to adjust for seasonal fluctuations. The chart below shows the number of people seeking a graduate-level occupation (not necessarily including all graduates on the CC) Source: JCP Data from the NOMIS Website
6. Similarly, Graduate-Level Occupation vacancies at Job Centre Plus show huge seasonal fluctuations. Any sustained increase in the moving-average may provide an early indication of improved conditions Source: JCP Data from the NOMIS Website
7. Degree Holders (both short-term (DLHE) and all holders) have a very different industrial sector profile to that for all workers in Scotland. Source: Annual Population Survey – July 2008 to June 2009
8. Quarterly Employee Jobs Estimates provide an indication of the fortunes of each Industrial Sector. Public Sector Employment (PSE) statistics also provide further detail for different areas within the Public Sector Public Administration, Education and Health Over the year to Sept 2009 Employee jobs up 1.3% to 737,700 (due mainly to Health – PSE statistics show NHS employment continues to grow) Banking, Finance and Insurance Over the year to Sept 2009 Employee jobs down 4.1% to 435,100 (PSE statistics report 16.0% contraction over the year up to Q4 2009 in those employed in Scotland by the recapitalised Financial Institutions) Construction and Manufacturing Over the year to Sept 2009 Employee jobs down 6.9% to 329,400 Distribution, Hotels and Restaurants Over the year to Sept 2009 Employee jobs down 1.9% to 511,900
9. The industrial profile of Degree-Holders in Scotland is very similar to the Northern Half of England. London and South/East have a more even match between Public Admin and Banking/Finance Source: Annual Population Survey – July 2008 to June 2009
10. Changes in both the working-age employment rate of those with degrees and those without vary by region. The bigger fall in degree-holder employment in London/South East may be due to the larger role of the Banking and Finance Sector in this region Source: Labour Force Survey
10. Changes in both the working-age unemployment rate of those with degrees and those without vary by region. London and the South East appear to have witnessed a larger increase in degree-holder unemployment than both Scotland and the North of England Source: Labour Force Survey
Discussion • 1. What questions and views do users have on this analysis? • 2. What might it suggest for the future? For those degree-holders already in the Labour Market? For those graduating in the summer of 2010? For those graduating in the years beyond 2010? • 3. What questions might this work raise for further analysis? Do any other sources of information exist to build on/complement this work? Are there other key questions in this field that our large-scale survey data could investigate? • 4. Do users have other interests in this field? (for example what happens to those with HE qualifications below degree level like HNCs/HNDs? Differences by age or gender? Longer-term destinations? • 5. Anything else?
Contact Lifelong Learning Statistics Branch Education Analytical Services Division Scottish Government 0300 244 1058 FHEStatistics@scotland.gsi.gov.uk March 2010