Download
1 / 23
230 likes | 367 Views
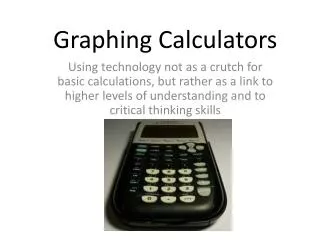
Graphing Calculators and Their Proper Usage in High School Mathematics Courses. Math 511: Trends in Math Education By: Tessa Helstad. Scientific Calculators. Can be used in all 9th-12th grade classrooms Graphing calculators might be more appropriate for 11th and 12th grades.

E N D
Graphing Calculators and Their Proper Usage in High School Mathematics Courses Math 511: Trends in Math Education By: Tessa Helstad
Scientific Calculators • Can be used in all 9th-12th grade classrooms • Graphing calculators might be more appropriate for 11th and 12th grades
Graphing CalculatorsRequired Usage for Math Courses • Not required for Algebra I or Geometry, but could be explored • Algebra II, Pre-Calculus, Statistics, and Calculus - buying by students is recommended or teachers could have a classroom set • TI-83s or TI-86s are the most common • TI-89s and TI-92s need to be monitored more and are probably not recommended for assessments
GRAPHING CALCULATORS TI-86 TI-83 plus (Silver Edition) TI-89 TI-92
Graphing Calculator’sRole in the Math Class • Classroom Discussions • Assessment Usage • Limited Assessment Usage • Homework Use • Exempted Use (homework/test) • Teachers must also be aware of topics students might figure out, therefore not allowing use on assessments
Should not be used . . . Operations involving fractions Graphing linear equations Order of operations Applying transformations (TI-92) Solving linear equations Could be used . . . Exploring systems of linear equations Exploring lines that best-fit data ALGEBRAI & GEOMETRY Example on next slide
Finding the best-fit line The following data relates the number of years of education (E) which a person completes and the average yearly income (I) in thousands of that person. Find the equation of the line that best fits the data. (I = mE + b) Classroom Discussion Only Years of 12 15 16 16 18 20 22 education Average Yearly 32 40 52 46 55 85 62 income (thousands) Algebra I Example (pg.1)
This might be the first time these students have ever explored a graphing calculator. Be sure to be patient and if possible have an aid to help out. With this grade level and this problem, I WOULD NOT show the students how the calculator can compute the linear equation. As the students are doing the problem on the calculator, have them graph the points on paper as well. Discuss scales. Then have them draw a best-fit line and choose two good points to calculate the slope, y-intercept, and write the equation. After the student has come up with the equation, then put the equation in the calculator to check the computation on the linear equation and then allow thoughts on whether it is the best-fit line and how you could improve the line. Experiment with the equations of many students and show how more than one answer is correct. Discuss rounding of numbers and how it affects the graph. Algebra I Example (pg.2) -Finding the best-fit line
Classroom Discussion Only 1. Turn plots on, with scatterplot, and L1 and L2 as x and y values 2. Put data in L1 and L2 table. 5. After calculating good equations, try them on your graph. Discuss good equations and what changes might make the line connect to more data. 3. Choose a good window or let calculator fit the data. 4. Select graph to view data points. Algebra I Example (pg.3) - Finding the best-fit line
Should not be used . . . Assessments should test the students on the patterns created by transformation of quadratics. Unit conversions Calculating with matrices Solving quadratic equations Assessing domain and range Could be used . . . To explore quadratic functions: translations and reflections. Exploring domains and ranges ALGEBRA II Example on next slide
Classroom Discussion and Student Exploration Parabola Transformations Algebra II Example 2. Parabola shifts left 5 3. Parabola shifts down 6. 1. Parabola reflects over x-axis or opens down. 4. Parabola, opens down or reflects over x-axis, shifts left 5, and down 6.
Could be used . . . To explore quadratic and cubic functions: translations and reflections. Calculate with matrices Explore amplitudes, periods, and shifts of sinusoids Solving quadratic equations Exploring complex rational functions Finding actual zeros from a list of possible zeros, when graphing with synthetic division Should not be used . . . To assess comprehension of cubic and quadratic functions. Some curves’ sketches should be visually represented on assessments without calculator usage. (ie. asymptotes, x and y intercepts, end behavior of 2nd and 3rd degree functions) Evaluteing trig ratios Graphs of y = 1/x or y = k x. PRE-CALCULUS Example on next slide
Exploring Sinusoids and their characteristics Classroom Discussion Only I chose this window. Radian Mode Sine Graph Amplitude = 3 Phase Shift = right п/4 Period = п Sine Graph Sine Graph Amplitude = 3 Phase Shift = right п/4 Sine Graph Amplitude of 3 Pre-Calculus Example
Should not be used . . . First introduction to mean, median, mode, box-and-whisker plots should be shown long hand. Could be used . . . Can easily calculate mean, median, and mode Can use tables and matrices to display data Creating histograms and box-and-whisker plots Computing two-variable data analysis Calculate permutations and combinations STATISTICS Example on next slide
Classroom, Homework, and Assessment Use Statistics Example (pg. 1) Use the following test scores: 80, 88, 91, 99, 100, 100, 79, 60, 75, 78, 82, and 88 to create a box-and-whisker plot. Label all statistics: quartiles, median, min, and max. Also note the values of the standard deviation, mean, and range. • I would recommend doing this example by paper-and-pencil method first, but these high school students could use their calculators for further problems.
Classroom, Homework, and Assessment Use 3. Let calculator fit the data. 1. Turn plots on with whisker plot selected. 2. Enter data in L1 table. 4. Select graph to view Box-and-Whisker Plot. 5. View 1-variable stats. Use TRACE to view stats. Statistics Example (pg. 2) BOX-AND-WHISKER PLOT ANALYZING 1-VARIABLE STATISTICS
Should not be used . . . Calculating areas under curves Could be used . . . Explore tangents of functions Find relative maxima and minima of functions Learn simple programming procedures Exploring limits of functions CALCULUS Example on next slide
Calculating the area under a curve using limits of x=2 to x=4. Calculators Exempted 2. Upper limit of x=4. (Notice that using trace we cannot get exactly 4) 1. Lower limit of x=2 (Notice that using trace we cannot get exactly 2) 3. This answer is approximate, because 2 and 4 were estimated. Calculus Example
PROGRAMMING FEATURES • Some basic programming can be taught to students. • Be careful though, because what you teach them they can use against you. • Recommended to only 12th grade courses. • Examples of programs: • Distance Formula • Midpoint Formula • GPA computation • Quadratic Formula (Advanced programming knowledge) Example on next slide
Writing the Distance Formula Running the Program and Computing Values Programming Example Writing, executing, and using the distance formula.
AdditionalTechnology • Link to transfer data between calculators • Link to connect to a computer and keyboard connection • CBLs and CBRs • TI-Presenter - video adapter connects to a TV or other projection device • ViewScreen panel sits atop a standard overhead projector
- Tools used to enhance graphing calculator uses in the classroom. CBR CBL TI- Navigator View Screen TI-Keyboard TI-Presenter Additional Technology
Bibliography • TI website (online). http://www.ti.com/ • NDCTM website (online). http://www.sendit.nodak.edu/ndctm/ • Advanced Mathematics: An Incremental Development 2nd Edition. Norman, OK. Saxon Publishers. May 1998