Download
1 / 44
440 likes | 619 Views
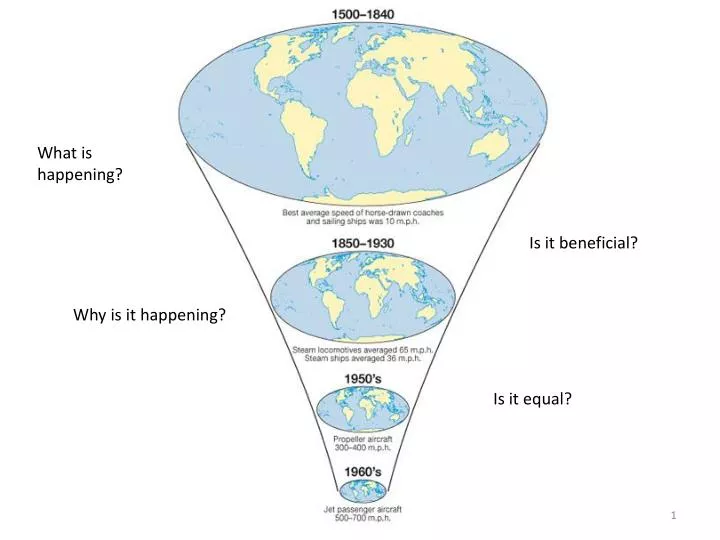
What is happening?. Is it beneficial?. Why is it happening?. Is it equal?. Time Space Convergence. Images taken from: http://people.hofstra.edu/geotrans/index.html.

E N D
What is happening? Is it beneficial? Why is it happening? Is it equal?
Images taken from: http://people.hofstra.edu/geotrans/index.html
Regional Space / Time Convergence (in minutes) The above graphs display a process of space / time convergence between two city pairs, London and Edinburgh (located 520 km apart) and New York and Boston (310 km apart). Both city pairs went through a different space / time convergence process. With the development of stage-coach services in the 18th and early 19th centuries, travel times declined substantially. However, by the 19th century stage-coaches reached their optimal efficiency and could no longer provide time improvements. The development of rail networks initiated a new phase of space / time convergence and by the early 20th century travel times were significantly lower than previous decades. The development of highways and then air transportation systems from the mid 20th century reduced travel times to 100 minutes between London and Edinburgh and to 70 minutes between New York and Boston. It is unlikely that these figures will change anytime soon. Contemporary space / time convergence dominantly takes place at a global level and are derived more from intermodal improvements than from modal speed improvements.
Wikipedia Time Space Convergence • Time–space compression (also known as space–time convergence) is a term used to describe processes that seem to accelerate the experience of time and reduce the significance of distance during a given historical moment.
Time-space convergence often refers to technologies that seem to accelerate or elide spatial and temporal distances, including technologies of communication (telegraph, telephones, fax machines, Internet), travel (rail, cars, trains, jets) and economics (the need to overcome spatial barriers, open up new markets, speed up production cycles, and reduce the turn-over time of capital).
Theorists generally identify two historical periods in which time-space compression occurred: • the period from the mid-19th century to the beginnings of the First World War, • and the end of the twentieth century. • In both of these time periods, according to Jon May and Nigel Thrift, “there occurred a radical restructuring in the nature and experience of both time and space ... both periods saw a significant acceleration in the pace of life concomitant with a dissolution or collapse of traditional spatial co-ordinates”.
Shipping and Containerisation Containerisation: The introduction and use of containers to transport products by lorry (truck), rail and sea. Containers come in a number of sizes all 2.4 metres wide and either 6.1, 12.2 13.7, 14.6 or 16.2 metres long.Refrigeration: This is the process of keeping something cool. Refrigeration has also been beneficial because it has allowed more perishable products like meat and fruit and vegetables to be transported by ship.TEU and FEU: Twenty foot equivalent unit and forty foot equivalent unit. These are the standard units used to measure shipping. TEU represents a container 20 foot 6.1 metres long and 2.4 metres wide with a maximum capacity of 24 tonnes. FEU is obviously a container twice as large.
Spot the difference! 2012 vs 1800’s
Containerisation and Ocean Transport Although containers have been used to transport products since the 18th century, it was not until after World War II that they became widely used and not until the 1960's that there sizes were standardised. The first ships to carry containers came into production in the early 1950's. However, in the early days of containers, their dimensions varied and it was until 1968 when the International Organisation for Standardisation (ISO) defined the dimensions of containers did they become standardised.
This standardisation made it much each for containers to be transferred between different ships as well as trains and lorries (trucks). Containerisation greatly increased the speed and reduced the cost of transporting products around the world. As well as increasing speed and reducing costs, they also reduced theft because cargo is hidden in containers and normally locked. In 2009, 90% on non-bulk cargo was transported by container and 26% of this came out of China. As world trade has increased so has the size of container ships. The largest container ships in the world are currently the Maersk Emma Class (seen right). The Maersk Emma Class are capable of transporting over 15,000 containers. Containers ships are expected to grow further, but will eventually be limited. Already they are too big for the current dimensions of the Panama Canal and many ports and if they grew much bigger will not be able to travel through major shipping routes like the Malacca Straits because of their depth.
Panama Canal Extension The Panama Canal runs through the Central American country of Panama connecting the Pacific Ocean with the Caribbean Sea (and Atlantic Ocean). The canal is 82km long - without the canal ships would be forced to take the long dangerous route around the tip of South America (Cape Horn). The canal was started in 1880 and finished in 1914. The canal which has been owned by Columbia, France, the US and now the Panama government had close to 15,000 ships pass through it in 2008. During their journey ships are forced to pass through three sets of locks. However, as ships have grown they have become two big to fit through the locks.
The largest ships the locks can accommodate are the Panamax class with a beam of about 32 metres and a capability of carrying about 5,000 containers. The latest container ships have a beam of over 55 metres and can carry over 15,000 containers. Because of this the Panama Canal is undergoing a huge expansion plan. The expansion plan announced in 2006 is expected to cost about $5.3 billion and is due to be completed in 2014. The plan is to build a third set of locks near the existing locks to take container ships up to 50 metres wide. Because of the importance of the route between the Pacific and the Atlantic and the potential profits that can be made two alternative routes have been suggested, one in Columbia (a railway supported by China) and one in Nicaragua.
The Box The journey of the box demonstrates how interdependent the world has become. Countries are no longer self-sufficient, but instead rely on each other for varying products. The container also travelled through a difficult time for the container industry, rising fuel prices and falling demand because of a global recession meant that their profits fell from a profits of $3 billion in 2008 to a loss of $20 billion in 2009. How Containerisation Changed the Modern World.
Container shipping can suffer from many problems including; containers lost overboard, cost of oil, cost of steel to build ships, waiting lists for ships, the size of ports and shipping routes, accidents, shipment times, the wrong location of containers and increasingly piracy. Many people consider piracy something that happen centuries ago, but it is on the rise again. The current piracy hotspot is in the Gulf of Aden in between Somalia and Yemen. Most pirates come from Somalia travel in small fast motorboats and carry weapons. They attack ships of all sizes, sometimes steeling cargo but more often taking crews hostage and demanding ransoms from ship owners or families of the hostages - depending on the size of the ships ransoms can be millions of dollars. The reason for the increase in piracy is not clear but may include, extreme poverty and lack of jobs in Somalia, the need for money to fund terrorist organisations like Al Shabab and past grievances about fishing grounds off Somalia been overfished by foreign boats. To try and combat piracy many countries have sent navy boats to patrol the waters in the Gulf of Aden. The presence of naval vessels has reduced attacks from a high of 86 a year, but piracy is still estimated to be costing the shipping industry $10 billion a year.
Air Travel – rapid development and change Describe the growth in Air Trafficsince 1950
Air Transport – Stages in Network Growth. Source: Adapted from O'Connor, K. (1995) "Airport Development in Southeast Asia", Journal of Transport Geography, Vol. 3, No. 4, pp. 269-279.
Stages in Air Network Development Four major stages can summarize air network development: Stage 1 (Initial development). During the 1930s basic linear services were established. Since the technical capabilities of aircrafts were limited, especially in terms of range, intermediate stops had to be made. For instance, a flight across the Pacific required stops at Hawaii, Wake, Midway, Guam and the Philippines islands. Stage 2 (By-passing effect). During the 1940s and 1950s, the technical capabilities of aircrafts improved substantially, which enabled to by-pass several intermediate stops. Routes between major destinations still had a linear structure.
Shortest Air Route between London and Sydney, 1955 - 2006 Since the inauguration of the first commercial regular long distance air services in the 1950s the relative distance between London and Sydney has been substantially reduced. When the route was serviced by the propeller plane Super Constellation, the segment took 2 and a half days and 7 stops to be serviced. The introduction of the 747 in the 1970s reduced this route to 26 hours and two stops. A more fuel efficient and longer range 747-400 improved the route by 3 hours because only one stop was then required. In 2006, for the first time, a direct flight became a possibility with a new generation of long range aircrafts such as the 777-200LR. However, this yet to be serviced route is at the extreme limit of serviceability as dominant winds would only make possible an east-west non-stop full load leg. Considering technical limitations linked with the ratio speed / fuel consumption, it is unlikely that the travel time between London and Sydney will become lower than the current 19.5 hours direct flight. SOURCE -http://people.hofstra.edu/geotrans/eng (accessed July 2012)
Stage 3 (Proximity effect). In the 1960s and 1970s, aircraft technology permitted long distance routes, which supported the development of a network structure reflecting better the size and function of markets. As such, the airports of large cities started to see the development of feeder services.
Air Transport – Developing Air Routes London to Sydney – 1955 - 2006
Air Transport – Developing Air Routes CONCORDE- Why these routes?
Stage 4 (Hubbing effect). Through the accumulated effect of hubbing, the 1980s and 1990s saw the creation of large hubs handling the great majority of air traffic, especially at the international level. Hub and spoke networks have the advantage of offering a larger market coverage (number of airports) with a smaller number of planes. A hub also enables to reconcile more effectively long distance and regional air services.
Describe the density and distribution of the global air traffic network. Remember this is passengers.
Air Transport – The jet engine AIR TRAFFIC
Air Passenger Transport – The jet engine Where do the 1.6 billion air passengers originate? The total number of people who get on an airplane per year is far fewer than a billion. AIR TRAFFIC
Freight Traffic 2003 Source: Clancy, B. and D. Hoppin (2004) The MergeGlobal 2004-2008 World Air Freight Forecast, MergeGlobal, Inc. Billions of tons per KM
Changing Trends. Accessed July 2012 Describe the trends in global airline traffic.