Download
1 / 20
200 likes | 380 Views
Are Public School Teachers ‘Underpaid?’ Some Evidence and Conjecture Michael Podgursky Department of Economics University of Missouri – Columbia NCES Summer Data Conference Washington D.C. July 25-29, 2005. Conclusion .

E N D
Are Public School Teachers ‘Underpaid?’Some Evidence and ConjectureMichael Podgursky Department of EconomicsUniversity of Missouri – ColumbiaNCES Summer Data ConferenceWashington D.C.July 25-29, 2005
Conclusion • NCES should take the lead in collecting objective data on the relative pay and benefits of public school teachers • Employer-based, not household or teacher survey
Circling the Question • Relative Pay - level and trend • Ability to Staff Classrooms with qualified teachers • Collective Choice failure • School districts are under-investing in quality relative to quantity
Current Population Survey (CPS) • Monthly Household survey (~60,000 hh’s) • Weekly earnings data from ¼ of survey (“outgoing rotation groups”, CPS-ORG) • Annual earnings data in March (previous year)
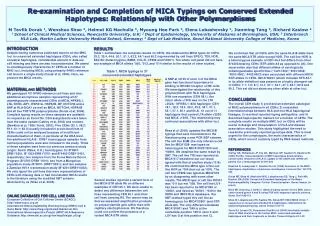
Table 1 Relative Annual and Weekly Earnings of Public and Private School Teachers: 2002 CPS-ORG and March, 2003 CPS Estimates a
Figure 1 Reported Weeks of Work for Public School Teachers in 2003 CPS_ORG
Table 2: Median Weekly and Annual Earnings for Public School Teachers: CPS-ORG and March, CPS
Table 3 Relationship Between Reported Weekly Earnings and Annual Earnings For Matched CPS Records, 2002: Public School Teachers a
Table 4 Missouri Teacher Earnings: Administrative Data and CPS-ORG Estimates
Table 2: Median Weekly and Annual Earnings for Public School Teachers: CPS-ORG and March, CPS
Figure 2 Teacher Pay Relative to Registered Nurses: Annual and Weekly for Largest U.S. Metropolitan Areas
Figure 3 Weighted Average Percent Pay Gap in Largest U.S. Metropolitan Statistical Areas: Teacher Pay Versus Selected Occupations (15 Largest MSA’s)
Paid Leave for Public School Teachers and Private Sector Workers as a Percent of Total Compensation: June 2004 Source: Bureau of Labor Statistics. Employer Costs for Employee Compensation – June 2004. (Sept. 15, 2005) Tables 4 and 5. www.bls.gov/ncs/ect/home.htm
Public-Private School Comparisons • Teachers in regular emphasis, non-religious private schools • 1999-2000 Schools and Staffing Surveys
Table 10 Pay Gap Between Full-Time Teachers in Private Non-Sectarian Schools and Public School Teachers
Selected Fringe Benefit Costs: Public School Teachers Versus Private Sector Professionals Source: U.S. Department of Labor, Bureau of Labor Statistics. “Employer Costs for Employee Benefits – June 2004.” (Sept. 15, 2004), Tables 4 and 5. www.bls.gov/ncs/ect/home.htm
Concluding Observations • Teacher labor markets are localized → local, not national, relative earnings matter • Markets differ by field • Employer data preferred to HH data • NCS provides good comparative data • Fringe benefit data are very important • Arms-length data collection (NCES)