Download
1 / 43
430 likes | 506 Views
Regression based on x vs. y, and lab canister difference = y - x. Bias Calculations All measurements were compared to DC-8. Therefore, DC-8 is chosen as a reference measurement and the regression of each instrument versus DC-8, minus DC-8 is the apparent bias.

E N D
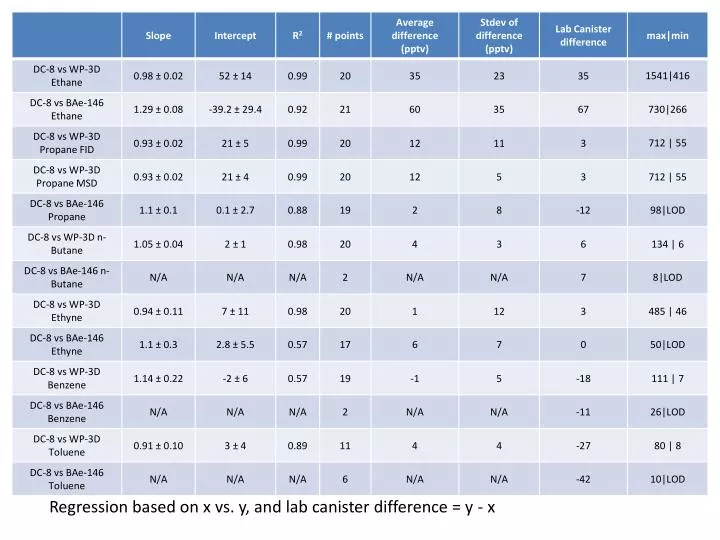
Regression based on x vs. y, and lab canister difference = y - x
Bias Calculations All measurements were compared to DC-8. Therefore, DC-8 is chosen as a reference measurement and the regression of each instrument versus DC-8, minus DC-8 is the apparent bias. Ex. From DC-8 vs WP-3D Ethane regression: WP-3D = 0.98 DC-8 + 52 Apparent bias = WP-3D – DC-8 = -0.02 DC-8 + 52 The “reference standard” is an average of the DC-8 vs DC-8 and DC-8 vs WP-3D apparent bias. Ex. DC-8 vs WP-3D Ethane: Standard = (-0.02 + 0)/2 DC-8 + (52 + 0)/2 Standard = -0.01 DC-8 + 26 This standard is then subtracted from each apparent bias to get the best estimate bias. After putting the best estimate bias in terms of the instrument being evaluated it is termed “recommended bias,” which is what is reported in the following slide. Ex. Best estimate bias for WP-3D Ethane Best estimate bias = (-0.02 DC-8 + 52) – (-0.01 DC-8 + 26) = -0.01 DC-8 + 26 In terms of WP-3D: Recommended bias = -0.0102 WP-3D + 26.5
DC-8 2σ uncertainty: 10% WP-3D 2σ uncertainty: 10% BAe-146 2σ uncertainty: Reported by point * Calculated after bias correction