Download
1 / 24
240 likes | 350 Views
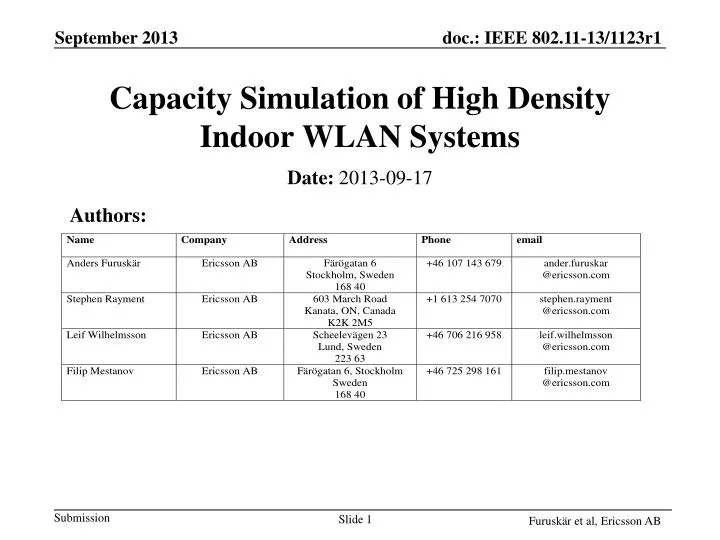
Capacity Simulation of High Density Indoor WLAN Systems. Date: 2013-09-17. Authors:. Abstract. Preliminary results from simulation of high density indoor WLAN systems. The simulation methodology is similar to the one used for evaluating cellular networks. Topics.

E N D
Capacity Simulation of High Density Indoor WLAN Systems Date:2013-09-17 Authors:
Abstract Preliminary results from simulation of high density indoor WLAN systems. The simulation methodology is similar to the one used for evaluating cellular networks
Topics • WLAN Multi-cell Performance Aspects • Models and Assumptions • Performance Metrics • Results • Summary
WLAN Multi-cell Performance Aspects • IEEE 802.11n and IEEE 802.11ac have similar physical layer characteristics as cellular systems, e.g. LTE • Modulation, channel coding, MIMO capabilities • But… • The CSMA/CA-based MAC limits densification • Nodes that hear each other cannot be active at the same time • This creates a re-use in the time domain • Operation in uncontrolled environments with external interference will further limit performance • Not modeled here
Models and Assumptions • IEEE 802.11n modulation and coding rates • 2.4 or 5GHz • Frequency reuse varied between 1 and 12 vs. isolated AP • Choose channels that maximize distance between APs that use the same frequency • One single 20MHz carrier per AP • AP and STA power 100mW (EIRP) • CS (Carrier Sense) threshold -85dBm • 2x2 MIMO in DL and UL • No external interference • File transfer traffic • 75% in downlink and 25% in uplink • MAC PDU size 65KB
Deployment Scenario • An office-like building with 80x50m footprint (similar to [2]) • Ten floors of height 3m • Interior walls every 10m (10x10m rooms) • Winner II propagation • Free-space propagation with inner wall loss of 12dB, and floor loss of 17dB for first floor and 4dB for following floors • Log-normal shadowing with standard deviation 8dB • Subscriber density 1/16m2 250/2500 per floor/building • ~30 subscribers per AP • 8 APs per floor, randomly deployed per floor, all floors same
Traffic Load per AP vs. Monthly Volume per User • Subscriber density 1/16m2 250/2500 per floor/building • 200 busy hours per month • Traffic per subscriber and month vs. busy hour traffic per floor • If we assume: 10 GB per monthper sub x 250 subs per floor / 200 busy hours per month = 27Mbps per floor or 3.4Mbps per AP
Performance Metrics • Cell-edge (5thpercentile) and Mean User Throughput (per BSS) vs. Traffic Load (similar to the one proposed in [3]) • ‘How much can the system be loaded before user experience gets unacceptable?’ Traffic load Traffic load
Isolated APs, 2.4GHz, DL • Served traffic is at most 40Mbps (to the 5th percentile) • Channel utilization approaching 75% (CSMA efficiency)
Reuse 3, 2.4GHz, DL • Served traffic is at most 12Mbps (to the 5th percentile) • Channel utilization approaching 30%
Reuse 1, 2.4GHz, DL • Served traffic is at most 7Mbps (to the 5th percentile) • Channel utilization approaching 10%
Reuse 1, 3, Isolated, 2.4GHz, UL • Same trends as in downlink
Capacity 2.4GHz • Maximum served traffic for cell-edge (5th percentile) considering user throughput of at least 5Mbps Isolated [100%] Isolated [100%] Reuse 3 [100%] Reuse 3 [100%]
Spectral Efficiency 2.4GHz • Capacity divided by total spectrum usage in used direction • Spectral Efficiency = Capacity / (reuse * 20MHz x F) • FDOWNLINK = 0.75, FUPLINK = 0.25 • Increases with tighter reuse, but still rather low Reuse 3 Reuse 3
Reuse 1-12, Isolated, 5GHz, DL and UL • Same trend as in 2.4GHz • Slightly better than 2.4GHz due to better isolation
Capacity 5GHz • Maximum served traffic for cell-edge (5th percentile) considering user throughput of at least 5Mbps Isolated [100%] Isolated [100%] Reuse 12 [100%] Reuse 12 [100%]
Spectral Efficiency 5GHz • Capacity divided by total spectrum usage in used direction • Spectral Efficiency = Capacity / (reuse * 20MHz x F) • FDOWNLINK = 0.75, FUPLINK = 0.25 • Increases with tighter reuse, but still rather low
Summary • High capacity multi cell systems can be built with WLAN technology (!) • Inter-cell carrier sensing limits performance • Possible to mitigate with more channels • Are there more spectrally efficient solutions? • Can we use this methodology (adopted from cellular network evaluations) to asses enhancements?
References [1] I. Siomina, A. Furuskär, and G. Fodor. A mathematical framework for statistical QoS and capacity studies in OFDM networks, Proc. of IEEE PIMRC ’09, Sep. 2009. [2] 11-13-1081-00-0hew-hew-simulation-methodology [3] 11-13-1137-02-0hew-definition-of-performance-metric
AP to STA Radio Characteristics September 2013 • Good coverage • Well above total gain of -100dB which corresponds to -80dBm received power • Good isolation geometry due to walls and floors
Radio Characteristics - Cell Isolation September 2013 • Propagation as a function of distance and floor • Total loss <105dB (received power >-85dBm) some two to three walls or floors away 2.4GHz 5.0GHz
Radio Characteristics - Cell Isolation September 2013 • An active AP triggers carrier sensing (>-85dBm) in 7.1 and 5.9 neighbor APs (on average) in 2.4GHz and 5.0GHz respectively • The graph shows average received power from neighbor APs in order of strength x x x x x x x x x x x x x x x x x x x x