Download
1 / 17
170 likes | 256 Views
Single and Multiple Substrate Kinetics.

E N D
Single and Multiple Substrate Kinetics • A culture grown in a simple medium including 0.3% wt/vol of glucose; at time t=0 , it is inoculated into a larger sterile volume of the identical medium that was shown at following result [X(1)]. The same species cultured in a complex medium is inoculated into a mixture of 0.15% glucose and 0.15% lactose [X(2)]. Evaluate the maximum specific growth rate mmax, the lag timetlag and the overal yield factors Y (gram cells per gram substrate), assuming substrate exhausting in each case. Explain the model kinetic of each case that was tended with shape of the growth curves. If the model kinetic of the single substrate is andrew equation, advice the equation of the above multiple substrate kinetics. • T (h) 0.0 0.5 1.0 1.5 2.0 2.5 3.0 3.5 4.0 4.5 5.0 5.5 6.0 6.5 7.0 7.5 8.0 • X(1)(g/l)0.06 0.08 0.11 0.14 0.20 0.26 0.37 0.49 0.70 0.88 1.04 1.04 • X(2)(g/l)0.06 0.06 0.06 0.07 0.10 0.13 0.18 0.26 0.32 0.43 0.48 0.50 0.52 0.60 0.84 1.0 1.0
Answer Sheet • Specific growth rate • Single substrate Multiple Substrate • Time Lag, single substrate tlag 0.0h • multiple substrate tlag(1) 1.0h tlag(2) 1.0h • Yield Factor, Single Substrate Y = (1.04-0.06)/3.0= 0.327 • Multiple Substrate Y(1) = (0.48-0.06)/1.5= 0.280 • Y(2) = (1.0-0.48)/1.5 = 0.347 • Multiple substrate kinetic model:
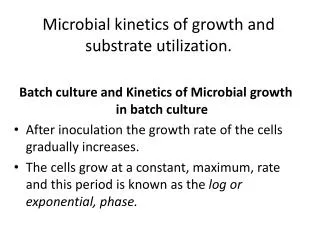
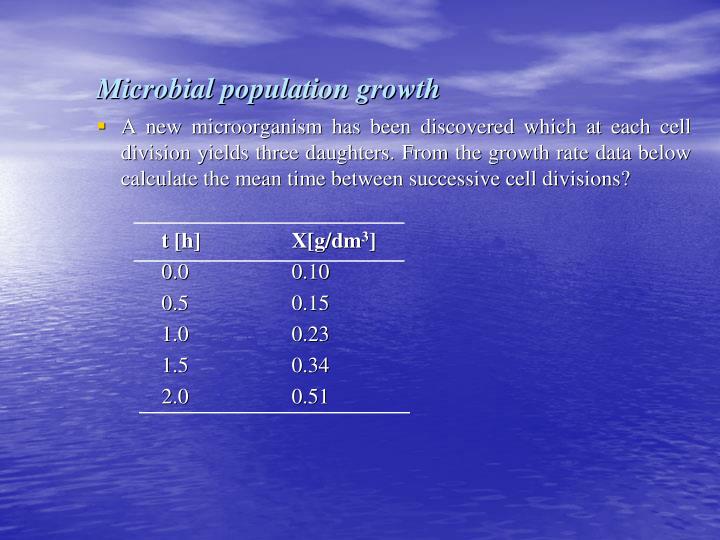
Microbial Population Growth • A new microorganism has been discovered which at each cell division yield (CDY) have 3 daughters. From the following result, calculate the mean time between successive cell division. • T[h] 0.0 0.5 1.0 1.5 2.0 • X[g/l] 0.10 0.15 0.23 0.34 0.51
Answer Sheet • Specific growth rate • Mean Time between successive cell division