Download
1 / 1
10 likes | 108 Views
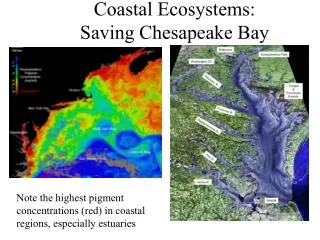
Ballast. Holocene. Pleistocene. Understanding Plant Distributions Surrounding Marsh Hammocks Within the Georgia Coastal Ecosystems LTER. Christine Hladik 1 , Alana Lynes 2 , Chester Jackson 3 , Merryl Alber 1 , Clark Alexander 4 , Steve Pennings 2.

E N D
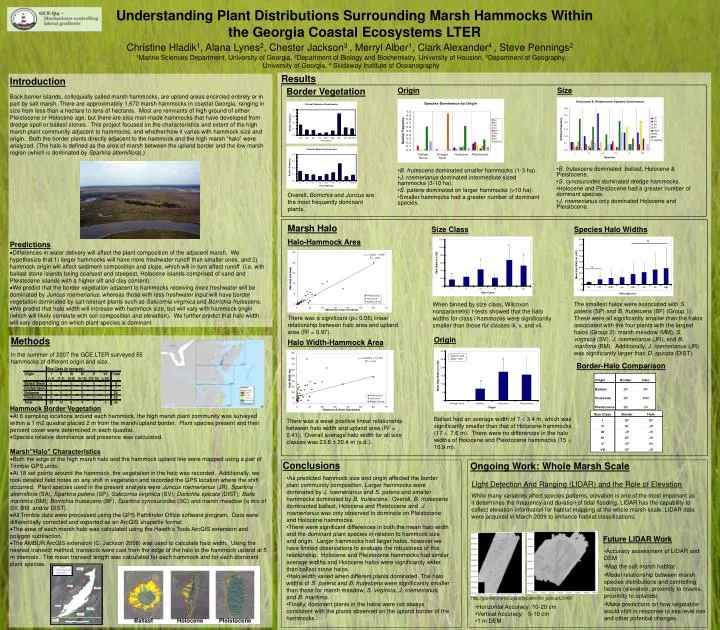
Ballast Holocene Pleistocene Understanding Plant Distributions Surrounding Marsh Hammocks Within the Georgia Coastal Ecosystems LTER Christine Hladik1, Alana Lynes2, Chester Jackson3 , Merryl Alber1, Clark Alexander4 , Steve Pennings2 1Marine Sciences Department, University of Georgia, 2Department of Biology and Biochemistry, University of Houston, 3Department of Geography, University of Georgia, 4 Skidaway Institute of Oceanography Results • Introduction Back barrier islands, colloquially called marsh hammocks, are upland areas encircled entirely or in part by salt marsh. There are approximately 1,670 marsh hammocks in coastal Georgia, ranging in size from less than a hectare to tens of hectares. Most are remnants of high ground of either Pleistocene or Holocene age, but there are also man-made hammocks that have developed from dredge spoil or ballast stones. This project focused on the characteristics and extent of the high marsh plant community adjacent to hammocks, and whether/how it varies with hammock size and origin. Both the border plants directly adjacent to the hammock and the high marsh “halo” were analyzed. (The halo is defined as the area of marsh between the upland border and the low marsh region (which is dominated by Spartina alterniflora).) Predictions • Differences in water delivery will affect the plant composition of the adjacent marsh. We hypothesize that 1) larger hammocks will have more freshwater runoff than smaller ones, and 2) hammock origin will affect sediment composition and slope, which will in turn affect runoff (i.e. with ballast stone islands being coarsest and steepest, Holocene islands comprised of sand and Pleistocene islands with a higher silt and clay content). • We predict that the border vegetation adjacent to hammocks receiving more freshwater will be dominated by Juncus roemerianus, whereas those with less freshwater input will have border vegetation dominated by salt-tolerant plants such as Salicornia virginica and Borrichia frutescens. • We predict that halo width will increase with hammock size, but will vary with hammock origin (which will likely correlate with soil composition and elevation). We further predict that halo width will vary depending on which plant species is dominant Border Vegetation Origin Size • B. frutescens dominated ballast, Holocene & Pleistocene. • S. cynosuroides dominated dredge hammocks. • Holocene and Pleistocene had a greater number of dominant species. • J. roemerianus only dominated Holocene and Pleistocene. • B. frutescens dominated smaller hammocks (1-3 ha). • J. roemerianus dominated intermediate sized hammocks (3-10 ha). • S. patens dominated on larger hammocks (>10 ha). • Smaller hammocks had a greater number of dominant species. Overall, Borrichia and Juncus are the most frequently dominant plants. Marsh Halo Size Class Species Halo Widths Halo-Hammock Area The smallest halos were associated with S. patens (SP) and B. frutescens (BF) (Group 1). These were all significantly smaller than the halos associated with the four plants with the largest halos (Group 2): marsh meadow (MM), S. virginica (SV), J. roemerianus (JR), and B. maritima (BM). Additionally, J. roemerianus (JR) was significantly larger than D. spicata (DIST). When binned by size class, Wilcoxon nonparametric t-tests showed that the halo widths for class i hammocks were significantly smaller than those for classes iii, v, and vii. There was a significant (p< 0.05) linear relationship between halo area and upland area (R2 = 0.97). Methods In the summer of 2007 the GCE LTER surveyed 55 hammocks of different origin and size. Origin Halo Width-Hammock Area Data for size class I only Border-Halo Comparison Hammock Border Vegetation • At 6 sampling locations around each hammock, the high marsh plant community was surveyed within a 1 m2 quadrat placed 2 m from the marsh/upland border. Plant species present and their percent cover were determined in each quadrat. • Species relative dominance and presence was calculated. Marsh”Halo” Characteristics • Both the edge of the high marsh halo and the hammock upland line were mapped using a pair of Trimble GPS units. • At 18 set points around the hammock, the vegetation in the halo was recorded. Additionally, we took detailed field notes on any shift in vegetation and recorded the GPS location where the shift occurred. Plant species used in the present analysis were Juncus roemerianus (JR), Spartina alterniflora (SA), Spartina patens (SP), Salicornia virginica (SV); Distichlis spicata (DIST); Batis maritima (BM); Borrichia frutescens (BF), Spartina cynosuroides (SC) and marsh meadow (a mix of SV, BM, and/or DIST). • All Trimble data were processed using the GPS Pathfinder Office software program. Data were differentially corrected and exported as an ArcGIS shapefile format. • The area of each marsh halo was calculated using the Hawth’s Tools ArcGIS extension and polygon subtraction. • The AMBUR ArcGIS extension (C. Jackson 2008) was used to calculate halo width. Using the nearest transect method, transects were cast from the edge of the halo to the hammock upland at 5 m intervals. The mean transect length was calculated for each hammock and for each dominant plant species. Ballast had an average width of 7 ± 3.4 m, which was significantly smaller than that of Holocene hammocks (17 ± 7.6 m). There were no differences in the halo widths of Holocene and Pleistocene hammocks (15 ± 10.9 m). There was a weak positive linear relationship between halo width and upland area (R2 = 0.41). Overall average halo width for all size classes was 23.8 ± 20.4 m (s.d.). Conclusions Ongoing Work: Whole Marsh Scale •As predicted hammock size and origin affected the border plant community composition. Larger hammocks were dominated by J. roemerianus and S. patens and smaller hammocks dominated by B. frutescens. Overall, B. frutescens dominanted ballast, Holocene and Pleistocene and J. roemerianus was only observed to dominate on Pleistocene and Holocene hammocks. •There were significant differences in both the mean halo width and the dominant plant species in relation to hammock size and origin. Larger hammocks had larger halos, however we have limited observations to evaluate the robustness of this relationship. Holocene and Pleistocene hammocks had similar average widths and Holocene halos were significantly wider than ballast stone halos. •Halo width varied when different plants dominated. The halo widths of S. patens and B. frutescens were significantly smaller than those for marsh meadow, S. virginica, J. roemerianus, and B. maritima. •Finally, dominant plants in the halos were not always consistent with the plants observed on the upland border of the hammocks. LIght Detection And Ranging (LIDAR) and the Role of Elevation While many variables affect species patterns, elevation is one of the most important as it determines the frequency and duration of tidal flooding. LIDAR has the capability to collect elevation information for habitat mapping at the whole marsh scale. LIDAR data were acquired in March 2009 to enhance habitat classifications. Future LIDAR Work • Accuracy assessment of LIDAR and DEM • Map the salt marsh habitat • Model relationship between marsh species distributions and controlling factors (elevation, proximity to creeks, proximity to uplands) • Make predictions on how vegetation would shift in response to sea level rise and other potential changes. http://gce-lter.marsci.uga.edu/public/file_pickup/LiDAR/ •Horizontal Accuracy: 10-20 cm •Vertical Accuracy: 5-10 cm •1 m DEM