Download
1 / 22
220 likes | 227 Views
Technological advancements in the production of crude oil and natural gas from new offshore and onshore fields are being witnessed across the globe. Due to such advancements in the global oil & gas sector and rising investments in the construction of pipelines, demand for industrial valves from the oil & gas sector is expected to grow until 2025. https://bit.ly/3o1ExGa

E N D
2015 – 2025 GLOBAL INDUSTRIAL VALVE MARKET FORECAST & OPPORTUNITIES www.techsciresearch.com MARKET INTELLIGENCE . CONSULTING
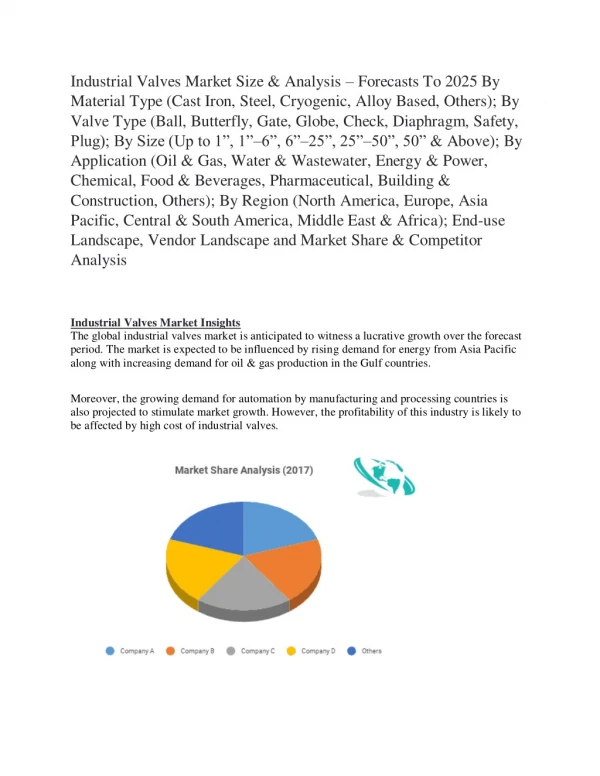
Scope of Report Product of Interest (POI): Industrial Valve The global industrial valve market is expected to witness significant growth during the forecast period owing to increasing need for industrial valves from oil and gas industry, smart city development initiatives across the globe and high demand for predictive maintenance techniques from other manufacturing industries. In power industry, valves are used for various applications, such as boiler startups, feed pump recirculation, steam conditioning, and turbine bypass. Market Segmentation APPLICATION VALVE TYPE REGION Year Range Oil & Gas • Globe Valves • North America • Refinery • Ball Valves • Europe • Review Period Chemical • Butterfly Valves • Middle East & Africa • Water • Wedge Gate Valves • 2015 – 2018 Asia-Pacific • Wastewater Effluent • Knife Gate Valves • South America • Base Year Power Generation • Check Valves • MATERIAL TYPE Agriculture • Diaphragm Valves • 2019 Mining • Pinch Valves • Estimated Year Cast Iron Others • • PRODUCT Float Valves • Steel • Air Valves • 2020 Cryogenic • Automatic Control Valves • Quarter-turn Valve Alloy Based Forecast Period • • Resilient Seal Gate Valves • Multi-turn Valve Others • • Others • 2021 – 2025 Others • 2
Table of Contents S. No. Contents Page No. 1. Product Overview 2. Research Methodology 3. Impact of COVID-19 on Global Industrial Valves Market 4. Executive Summary 5. Voice of Customer 6. Global Industrial Valves Market Outlook 6.1. Market Size & Forecast 6.1.1. By Value & Volume 6.2. Market Share & Forecast (Value) By Valve Type (Globe Valves, Ball Valves, Butterfly Valves, Wedge Gate Valves, Knife Gate Valves, Check Valves, Diaphragm Valves, Pinch Valves, Float Valves, Air Valves, Automatic Control Valves, Resilient Seal Gate Valves & Others) 6.2.1. 6.2.2. By Material Type (Cast Iron, Steel, Cryogenic, Alloy Based, Others) By Application (Oil & Gas, Refinery, Chemical, Water, Wastewater Effluent, Power Generation, Agriculture, Mining & Others) 6.2.3. 6.2.4. By Product (Quarter-turn Valve, Multi-turn Valve, Others) 6.2.5 By Company (2019) 6.2.6. By Region (Asia-Pacific, Europe, North America, South America and Middle East & Africa) 6.3. Product Market Map 7. Asia-Pacific Industrial Valves Market Outlook 7.1. Market Size & Forecast 7.1.1. By Value & Volume 3
Table of Contents S. No. Contents Page No. 7.2. Market Share & Forecast (Value) 7.2.1. By Valve Type 7.2.2. By Material Type 7.2.3. By Application 7.2.4. By Product 7.2.5. By Country (China, India, Japan, South Korea, Australia) 7.3. Asia-Pacific: Country Analysis 7.3.1. China Industrial Valves Market Outlook 7.3.1.1. Market Size & Forecast By Value & Volume 7.3.1.1.1. 7.3.1.2. Market Share & Forecast (Value) 7.3.1.2.1. By Valve Type 7.3.1.2.2. By Material Type 7.3.1.2.3. By Application 7.3.2. India Industrial Valves Market Outlook 7.3.2.1. Market Size & Forecast 7.3.2.1.1. By Value & Volume 7.3.2.2. Market Share & Forecast (Value) 7.3.2.2.1. By Valve Type 4
Table of Contents S. No. Contents Page No. 7.3.2.2.2. By Material Type 7.3.2.2.3. By Application 7.3.3. Japan Industrial Valves Market Outlook 7.3.3.1. Market Size & Forecast 7.3.3.1.1. By Value & Volume 7.3.3.2. Market Share & Forecast (Value) 7.3.3.2.1. By Valve Type 7.3.3.2.2. By Material Type 7.3.3.2.3. By Application 7.3.4. South Korea Industrial Valves Market Outlook 7.3.4.1. Market Size & Forecast By Value & Volume 7.3.4.1.1. 7.3.4.2. Market Share & Forecast (Value) 7.3.4.2.1. By Valve Type 7.3.4.2.2. By Material Type 7.3.4.2.3. By Application 7.3.5. Australia Industrial Valves Market Outlook 7.3.5.1. Market Size & Forecast By Value & Volume 7.3.5.1.1. 5
Table of Contents S. No. Contents Page No. 7.3.5.2. Market Share & Forecast (Value) 7.3.5.2.1. By Valve Type 7.3.5.2.2. By Material Type 7.3.5.2.3. By Application 8. Europe Industrial Valves Market Outlook 8.1. Market Size & Forecast 8.1.1. By Value & Volume 8.2. Market Share & Forecast (Value) 8.2.1. By Valve Type 8.2.2. By Material Type 8.2.3. By Application 8.2.4. By Product 8.2.5. By Country (France, Germany, United Kingdom, Italy, Russia) 8.3. Europe: Country Analysis 8.3.1. France Industrial Valves Market Outlook 8.3.1.1. Market Size & Forecast By Value & Volume 8.3.1.1.1. 8.3.1.2. Market Share & Forecast (Value) 8.3.1.2.1. By Valve Type 6
Table of Contents S. No. Contents Page No. 8.3.1.2.2. By Material Type 8.3.1.2.3. By Application 8.3.2. Germany Industrial Valves Market Outlook 8.3.2.1. Market Size & Forecast By Value & Volume 8.3.2.1.1. 8.3.2.2. Market Share & Forecast (Value) 8.3.2.2.1. By Valve Type 8.3.2.2.2. By Material Type 8.3.2.2.3. By Application 8.3.3. United Kingdom Industrial Valves Market Outlook 8.3.3.1. Market Size & Forecast 8.3.3.1.1. By Value & Volume 8.3.3.2. Market Share & Forecast (Value) 8.3.3.2.1. By Valve Type 8.3.3.2.2. By Material Type 8.3.3.2.3. By Application 8.3.4. Italy Industrial Valves Market Outlook 8.3.4.1. Market Size & Forecast By Value & Volume 8.3.4.1.1. 7
Table of Contents S. No. Contents Page No. 8.3.4.2. Market Share & Forecast (Value) 8.3.4.2.1. By Valve Type 8.3.4.2.2. By Material Type 8.3.4.2.3. By Application 8.3.5. Russia Industrial Valves Market Outlook 8.3.5.1. Market Size & Forecast By Value & Volume 8.3.5.1.1. 8.3.5.2. Market Share & Forecast (Value) 8.3.5.2.1. By Valve Type 8.3.5.2.2. By Material Type 8.3.5.2.3. By Application 9. North America Industrial Valves Market Outlook 9.1. Market Size & Forecast 9.1.1. By Value & Volume 9.2. Market Share & Forecast (Value) 9.2.1. By Valve Type 9.2.2. By Material Type 9.2.3. By Application 9.2.4. By Product 8
Table of Contents S. No. Contents Page No. 9.2.5. By Country (United States, Canada, Mexico) 9.3. North America: Country Analysis United States Industrial Valves Market Outlook 9.3.1. 9.3.1.1. Market Size & Forecast By Value & Volume 9.3.1.1.1. 9.3.1.2. Market Share & Forecast (Value) 9.3.1.2.1. By Valve Type 9.3.1.2.2. By Material Type 9.3.1.2.3. By Application 9.3.2. Canada Industrial Valves Market Outlook 9.3.2.1. Market Size & Forecast By Value & Volume 9.3.2.1.1. 9.3.2.2. Market Share & Forecast (Value) 9.3.2.2.1. By Valve Type 9.3.2.2.2. By Material Type 9.3.2.2.3. By Application 9.3.3. Mexico Industrial Valves Market Outlook 9.3.3.1. Market Size & Forecast By Value & Volume 9.3.3.1.1. 9
Table of Contents S. No. Contents Page No. 9.3.3.2. Market Share & Forecast (Value) 9.3.3.2.1. By Valve Type 9.3.3.2.2. By Material Type 9.3.3.2.3. By Application 10. South America Industrial Valves Market Outlook 10.1. Market Size & Forecast 10.1.1. By Value & Volume 10.2. Market Share & Forecast (Value) 10.2.1. By Valve Type 10.2.2. By Material Type 10.2.3. By Application 10.2.4. By Product 10.2.5. By Country (Brazil, Argentina, Venezuela) 10.3. South America: Country Analysis 10.3.1. Brazil Industrial Valves Market Outlook 10.3.1.1. Market Size & Forecast By Value & Volume 10.3.1.1.1 10.3.1.2. Market Share & Forecast (Value) 10.3.1.2.1. By Valve Type 10
Table of Contents S. No. Contents Page No. 10.3.1.2.2. By Material Type 10.3.1.2.3. By Application 10.3.2. Argentina Industrial Valves Market Outlook 10.3.2.1. Market Size & Forecast By Value & Volume 10.3.2.1.1 10.3.2.2. Market Share & Forecast (Value) 10.3.2.2.1. By Valve Type 10.3.2.2.2. By Material Type 10.3.2.2.3. By Application 10.3.3. Venezuela Industrial Valves Market Outlook 10.3.3.1. Market Size & Forecast By Value & Volume 10.3.3.1.1 10.3.3.2. Market Share & Forecast (Value) 10.3.3.2.1. By Valve Type 10.3.2.2.2. By Material Type 10.3.2.2.3. By Application 11. Middle East & Africa Industrial Valves Market Outlook 11.1. Market Size & Forecast 11.1.1. By Value & Volume 11
Table of Contents S. No. Contents Page No. 11.2. Market Share & Forecast (Value) 11.2.1. By Valve Type 11.2.2. By Material Type 11.2.3. By Application 11.2.4. By Product 11.2.5. By Country (South Africa, Saudi Arabia, UAE) 11.3. Middle East & Africa : Country Analysis South Africa Industrial Valves Market Outlook 11.3.1. 11.3.1.1. Market Size & Forecast By Value & Volume 11.3.1.1.1. 11.3.1.2. Market Share & Forecast (Value) 11.3.1.2.1. By Valve Type 11.3.1.2.2. By Material Type 11.3.1.2.3. By Application 11.3.2. Saudi Arabia Industrial Valves Market Outlook 11.3.2.1. Market Size & Forecast By Value & Volume 11.3.2.1.1. 11.3.2.2. Market Share & Forecast (Value) 11.3.2.2.1. By Valve Type 12
Table of Contents S. No. Contents Page No. 11.3.2.2.2. By Material Type 11.3.2.2.3. By Application UAE Industrial Valves Market Outlook 11.3.3. 11.3.3.1. Market Size & Forecast By Value & Volume 11.3.3.1.1. 11.3.3.2. Market Share & Forecast (Value) 11.3.3.2.1. By Valve Type 11.3.3.2.2. By Material Type 11.3.3.2.3. By Application 12. Market Dynamics 12.1. Drivers 12.2. Challenges 13. Market Trends & Developments 14. Pricing Analysis 15. Competitive Landscape 15.1. Competition Outlook 15.2. Players Profiled (Leading Companies) 16. Strategic Recommendations 17. About Us & Disclaimer 13
RESEARCH METHODOLOGY
Research Methodology Market Profiling Data Analysis Data Data Developing List of Respondents Formulating Questionnaire Collection Validation In-depth secondary research was conducted to determine top players in the global industrial valve market, overall market size and segmental market size. The data was scrutinized using MS-Excel, statistical tools and internal proprietary database to obtain qualitative and quantitative insights about the global industrial valve market. Data obtained as a result of primary and secondary research was validated through rigorous triangulation. TechSci conducted interviews with industry experts and industry players for data collection and verification. In order to conduct industry experts’ interviews, TechSci formulated a detailed discussion guide. List of industry players and industry specialists was developed. Primary Research Desk Research Company Analysis ✓ ✓ Recent Developments Market Changing Aspects/Dynamics Government Policies Conclusion ✓ ✓ Market Participants Key Strengths ✓ Identifying Key Opinion Leaders Questionnaire Design In-depth Interviews Actionable Insights Data Filter & Analysis Business Solution Research & Intelligence Data Collection ✓ ✓ ✓ ✓ Primary Research Secondary Research Paid Sources LinkedIn TechSci Internal Database Company Websites Company Annual Reports White Paper Study Financial Reports Investor Presentations Regulatory Body Associations, etc. Factiva Hoovers ✓ ✓ ✓ ✓ ✓ ✓ ✓ ✓ ✓ ✓ ✓ 15
Research Methodology Baseline Methodology Our dedicated team of industry experts has monitored and analyzed various aspects of the global industrial valve market. The team has analyzed the outlook of various segments of this market, while considering the major influencing factors such as rising number of government initiatives towards water treatment and increasing number of commercial construction projects. The study includes market forecasting, which would enable our clients to take better decisions while planning their strategy to achieve sustainability in the global industrial valve market. Methodology Followed for Calculation of Market Size: Market Size by Value & Volume: Market size, in terms of value & volume, for the year 2019 was calculated based on information collected • through exhaustive secondary research and primary surveys, with various key opinion leaders/stakeholders, such as industrial valve manufacturing companies, channel partners, market influencers & end users, industry experts, and other industry participants. The team interviewed more than 15 – 20 industrial valve manufacturing companies, 100 – 120 end users, 15 – 20 industry experts and other value • chain stakeholders in the global industrial valve market to obtain the overall market size from 2015 to 2019, which was validated by the Delphi technique. Taking standard deviation into consideration, the market size was averaged out, to arrive at the market size data during 2015-2019. 16
Research Methodology Respondents were asked about the current and future market growth rates, market shares by valve type, by application, by material type, by • product, by each region, and by company. Removing the outlier responses, the geometric mean of growth estimates and provider wise revenue shares generated across various segments were considered, to arrive at the final revenue shares. Revenue shares generated across various segments were further triangulated from other stakeholders. Methodology Followed for Calculation of Market Shares: Market shares shares by valve type, by application, by material type, by product, by each region, and by company were calculated based on the • responses received through primary surveys with industry experts, in which the respondents were asked about the market shares or revenue generated from various segments of industrial valve markets. The final shares were calculated by taking the geometric mean of the responses gathered from key opinion leaders after eliminating the outliers. Methodology Followed for Forecasting: TechSci Research performed periodical checks on data collected through the surveys with logic checks and analyzed the survey results in • SPSS/Tableau Software. Data triangulation techniques were applied to fill the gaps and to present a more meaningful picture of the market. To forecast global industrial • valve market, TechSci Research used various forecast techniques such as: Moving Average ✓ Time Series Analysis ✓ Regression Analysis ✓ Econometric and Judgmental Analysis ✓ 17
Research Methodology TechSci Research used its own forecast tool, which is based on the growth of various allied industries in respective regions. TechSci Research also used the impact analysis during short, medium and long term period to estimate the demand and to reach accurate market numbers. It should be noted that the figures compiled are only for the organized market including market share data. The currency used in the report is the United States Dollar (USD), with the market size indicated in USD million. Partial List of Companies Interviewed Key Secondary Sources Emerson Electric Co. Flowserve Corporation Alfa Laval Corporate AB Crane Co. CIRCOR International, Inc CURTISS-WRIGHT CORPORATION IMI plc MRC Global INC Metso Corporation Neway Valve (Suzhou) Co., Ltd. The Weir Group PLC Velan Inc. ITT Inc. INVINCIBLE VALVES (PTY) LTD Cameron International L&T Valves Limited A.C. VALVES CC Ainsworth Engineering (PTY) LTD AZ-Armaturen South Africa (Pty) Ltd COBRA ISCA (Pty) Ltd DUAL VALVES (PTY) LTD eDart Slurry Valves Pty Ltd A.R.I. FLOW CONTROL AFRICA (PTY) LTD FLOVAL Pty Ltd Ithuba Valves & Industrial Supplies cc Paltechnologies Pty Ltd AVK Holdings SA Pty Ltd RGR Technologies Pty Ltd World Bank TechSci Research Proprietary Database & Knowledge Repository Company Annual Reports Industry Magazines Industry Reports News Dailies Credible Paid Databases ▪ ▪ ▪ ▪ ▪ ▪ ▪ ▪ ▪ ▪ ▪ ▪ ▪ ▪ ▪ ▪ ▪ ▪ ▪ ▪ ▪ ▪ ▪ ▪ ▪ ▪ ▪ ▪ ▪ ▪ ▪ ▪ ▪ ▪ ▪ 18
Indusrty Brief According to TechSci Research report, “Global Industrial Valves Market By Valve Type, By Material Type, By Application, By Product, By Region, Competition, Forecast & Opportunities, 2025”, the global industrial valves market is projected to reach $ 84 billion by 2025, backed by growing demand for industrial valves from energy, oil & gas and various other industries. Moreover, growing need to develop water & wastewater infrastructure, increasing quest for reliable and clean power sources, rising pubic as well as private investments in diverse end-use sectors, etc., are expected to boost demand for industrial valves in the coming years, globally. Increasing number of manufacturing facilities and growing potential of replacement industrial valves market is also anticipated to positively influence the global industrial valves market during forecast period. In the valve type segment, the global industrial valves market was dominated by globe valves in 2019, owing to features such as low resistance to fluid flow and superior sealing capabilities. Second and third largest market segment included ball valve and butterfly valve segments, and this trend is anticipated to continue during the forecast period. Technological advancements in the production of crude oil and natural gas from new offshore and onshore fields are being witnessed across the globe. On account of these advancements in the oil & gas sector coupled with growing investments in the construction of pipelines to execute efficient transportation of oil & gas, demand for industrial valves from global oil & gas sector is expected to increase at a robust pace through 2025. Furthermore, the technological advancements such as IoT, additive manufacturing, etc., are strengthening the global industrial valve market. End-user industries such as chemical, paper & pulp and water treatment can save 70%-80% of valve monitoring cost with wireless IoT sensors. “With growing population and depleting water resources across the globe, need for clean water and sanitation has become the need of the hour. Numerous governments are taking initiatives and measures to meet the growing demand for water supply from booming global population. Huge investments being made to upgrade and replace the aging water and wastewater facilities, globally, are anticipated to propel growth in the global industrial valves market in the ensuing years.”, said Mr. Karan Chechi, Research Director at TechSci Research, a research based global management consulting firm. 19
Sample Data - Snapshot Global Industrial Valve Market Size, By Value (USD Million) & By Volume (Million Units), 2015–2025F 15.00 110.00 14.00 100.00 13.00 90.00 12.00 80.00 11.00 70.00 10.00 60.00 9.00 50.00 8.00 40.00 7.00 30.00 6.00 20.00 5.00 10.00 CAGR By Value & Volume XX% CAGR By Value & Volume YY% 2015 2019 2020E 2025F By Value (USD Million) By Volume (Million Units) North America Industrial Valve Market Share, By Valve Type, By Value, 2015–2025F Globe Valves Knife Gate Valves Float Valves Ball Valves Check Valves Air Valves Butterfly Valves Diaphragm Valves Automatic Control Valves Wedge Gate Valves Pinch Valves Resilient Seal Gate Valves 10% 10% 5% 10% 10% 5% 10% 5% 5% 5% 5% 10% 10% 2025F 10% 10% 5% 10% 10% 5% 10% 5% 5% 5% 5% 10% 10% 2024F 10% 10% 5% 10% 10% 5% 10% 5% 5% 5% 5% 10% 10% 2023F 10% 10% 5% 10% 10% 5% 10% 5% 5% 5% 5% 10% 10% 2022F 10% 10% 5% 10% 10% 5% 10% 5% 5% 5% 5% 10% 10% 2021F 10% 10% 5% 10% 10% 5% 10% 5% 5% 5% 5% 10% 10% 2020E 10% 10% 5% 10% 10% 5% 10% 5% 5% 5% 5% 10% 10% 2019 10% 10% 5% 10% 10% 5% 10% 5% 5% 5% 5% 10% 10% 2018 10% 10% 5% 10% 10% 5% 10% 5% 5% 5% 5% 10% 10% 2017 10% 10% 5% 10% 10% 5% 10% 5% 5% 5% 5% 10% 10% 2016 10% 10% United States Industrial Valve Market Share, By Material Type, By Value, 2015–2025F Cast Iron Steel Cryogenic 5% 10% 10% 5% 10% 5% 5% 5% 5% 10% 10% 2015 Alloy Based Others 20% 20% 20% 20% 20% 2025F 20% 20% 20% 20% 20% 20% 20% 20% 20% 20% 2023F 20% 20% 20% 20% 20% 20% 20% 20% 20% 20% 2021F 20% 20% 20% 20% 20% 20% 20% 20% 20% 20% 2019 20% 20% 20% 20% 20% 20% 20% 20% 20% 20% 2017 20% 20% 20% 20% 20% 20% 20% 20% 20% 20% 2015 20
Report Ordering Report Name: GLOBAL INDUSTRIAL VALVE MARKET FORECAST & OPPORTUNITIES 2015 – 2025 License Type Price Single User License $4450 Multi-User License $5450 Custom Research License $9450 To View Sample OR Purchase Report 21
About Us & Disclaimer TechSci Research is a global market research and consulting company with offices in the US, UK and India. TechSci Research provides market research reports in number of areas to organizations. The company uses innovative business models that focus on improving productivity, while ensuring creation of high-quality reports. The proprietary forecasting models use various analyses of both industry-specific and macroeconomic variables on a state-by-state basis to produce a unique ‘bottom-up’ model of a country, regional and global industry prospects. Combined with the detailed analysis of company activity and industry trends, the result is a uniquely rich evaluation of the opportunities available in the market. Related Reports Peru Industrial Valves Market By Type of Valve (Ball, Butterfly, Gate, Globe, Check, Plug, Others), By Product (Quarter-turn Valve, Multi-turn Valve, Others), By Material Type (Cast Iron, Steel, Cryogenic, Alloy Based, Others), By Size (Up to 1”, 1–6”, 6–25”, 25–50”, 50” and Above), By End User Industry (Oil & Gas, Refinery, Power Generation, Chemicals, Water & Wastewater, Others), By Region, Competition, Forecast & Opportunities, 2025 • India Motor Control Centers Market By Type (Intelligent v/s Conventional), By Voltage (Low, Medium, High), By Component (Busbars, Overload Relays, Variable Speed Drives, Soft Starters, Others), By Standard (IEC, NEMA, Others), By End User Industry (Oil & Gas, Chemical & Petrochemicals, Energy & Utilities, Mining, Others), By Region, Competition, Forecast & Opportunities, 2025 • TechSci Research – North America 708 Third Avenue, Manhattan, New York, United States Tel: +1- 646- 360- 1656 Email: sales@techsciresearch.com www.techsciresearch.com TechSci Research – Europe 54, Old brook, Bretton, Peterborough, United Kingdom Email: sales@techsciresearch.com www.techsciresearch.com TechSci Research – Asia-Pacific B – 44, Sector – 57, Noida, National Capital Region, U.P. - India Tel: +91-120-4523900 Email: sales@techsciresearch.com www.techsciresearch.com Disclaimer The contents of this report are based on information generally available to the public from sources believed to be reliable. No representation is made that it is timely, accurate or complete. TechSci Research has taken due care and caution in compilation of data as this has been obtained from various sources including which it considers reliable and firsthand. However, TechSci Research does not guarantee the accuracy, adequacy or completeness of any information and it is not responsible for any errors or omissions or for the results obtained from the use of such information and especially states that it has no financial liability whatsoever to the subscribers / users of this report. The information herein, together with all estimates and forecasts, can change without notice. All the figures provided in this document are indicative of relative market size and are strictly for client’s internal consumption. Usage of the same for purpose other than internal will require prior approval of TechSci Research.