Download
1 / 12
130 likes | 344 Views
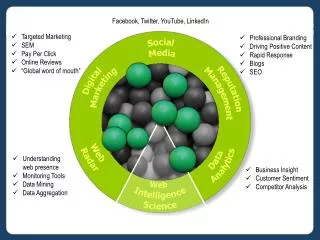
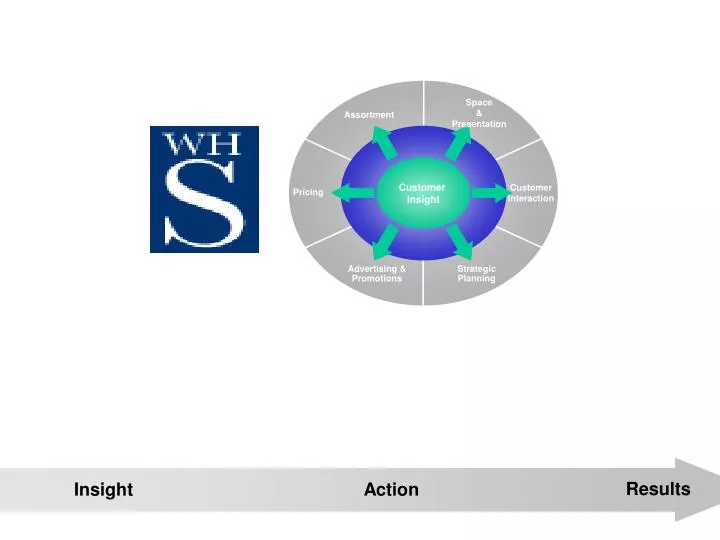
Results. Insight. Action. Space & Presentation. Assortment. Customer Insight. Customer Interaction. Pricing. Advertising & Promotions. Strategic Planning. Customer traffic flow map. Customer dwell map. 3.3 Monitor Competitor Pricing. High-Level Product and Information Flow 1.

E N D
Results Insight Action Space & Presentation Assortment Customer Insight Customer Interaction Pricing Advertising & Promotions Strategic Planning
Customer traffic flow map Customer dwell map
High-Level Product and Information Flow1 Sales data to trigger Replenishment, Forecast Data, PO Advance Shipping Notice (ASN) Time Slot Availability ASN Time Slot Availability Carrier Carrier Retail DC/ Returns Center Catalog/ eFulfillment Centers Consolidation Center Carrier Inventory Availability, Account Info, Order Status, Request for Routing Product Flow (Forward & Reverse Logistics) Information Flow The flow of products is relatively uniform across retailers whereas the flow of information typically varies considerably between advanced and basic value chains. Vendor (OEM, Contract Mfr, Wholesalers) Stores Customer Web Stores Legend 1Represents an advanced value chain in terms of information flow. Basic value chain typically has much less information flow
The retail process chain encompasses a broad set of processes and value drivers, and is relatively constant across major retail categories. Retail Processes and Opportunities Supply Chain Related CRM Chain Related Source Move Hold Replenish Market Sell Serve Processes Space & Assortment Optimization Dynamic Fulfillment Integrated & Synchronized Planning • Assortment and space allocations tailored to the local market based on mathematical patterns in local consumer buying behaviors. • Assortment Concept Strategy • Category Management • Local Market Assortments • Provide flexibility and responsive-ness to fulfill consumer demand. Manage pipeline exceptions and tailor capacity to changing flow needs. • Multi-Channel Fulfillment • Logistically Distinct Flow Paths • Outsourcing & 4PL • Global Logistics • Transportation Management • Integrated Distribution Operations & Systems • Align the entire supply chain with a single “version of the truth.” Build consensus within the enterprise and across trading partner relationships. • Integrated Financial and Merchandise Planning • Pipeline Visibility and Capacity Planning • Demand Driven Forecasting Opportunities per Accenture’s Proprietary “Scientific Retailing” Methodology Store/Customer Contact • Integration of store levers to ensure alignment with customer requirements and execution of corporate strategy. • Demand Driven Labor Allocation • Product Adjacency • Category Positioning • Customer Driven Operations • Selling Strategy Strategic Sourcing & Vendor Relations Optimized In-stock Mgmt. 1 Price Optimization • Precision ordering, replenishment, and allocation methods through the product lifecycle. Accurate determination of product segmentation and demand characteristics. • Open-to-Buy Optimization • Time Phased Order Planning • Size, Color, Inner-Pack Optimization • Markdown Optimization • Proactive pricing strategy which optimizes image, traffic, and profit pricing based on volume, price point, and elasticity analysis. • Price Halo Strategy • Profit Pricing • SKU Intensive Pricing • Integrated Advertising, Signage, and Merchandising Pricing Execution • Collaborate with global trading partners to design, plan, and manage the flow of products in a proactive and fact-based manner. • Strategic Sourcing • Private Label Management • eMarketplaces • Fact Based Negotiation • Vendor Performance and Profitability Fact-Based Advertising • Allocation of resources based on forecasted results. Selection of items based on incremental gross margin and/or traffic return. • Image Development & Mgmt. • Departmental Ad Responsiveness • Ad Item/Event Effectiveness • Ad Planning & Production Process 1Some opportunities overlap with CRM
Source Move Hold Replenish Market Sell Serve
abcd abcd Logistics Network 6 RDC’s Daventry Heywood Magna Park Bridgwater Basildon Castleford (inc. Centralised High Risk) abcd abcd K & N Imports Minworth Welwyn Gdn. abcd Acton Gate White Arrow
Customer Supplier Community Management Information Planning and Marketing Merchandise Management Retail Operations Electronic Information Exchange Channel to Customer Supply Chain and Distribution Finance HR/Payroll
Merchandise Assortment Services Consumer Interaction Consumer Insight Retail Consumer Equity ChannelDesign Pricing Consumer-Centric Strategy & Tactical Action Marketing Strategic Planning
ARGOS LEADS E-COMMERCE REVOLUTION ARGOS VOTED MOST ADMIRED COMPANY FOR 2ND YEAR RUNNING www.Argos.co.uk
Regional Distribution Centres and Store Service Regions (non peak vs. peak) No. of Stores Peak No. of Stores Non Peak Week 40 ‘99 Week 5 ‘00 DC Castleford 52 66 Data for FY ’99 Av. Miles Per Deliv: 124 Av. Deliv. Per Trip: 1.27 Av ULCs per Deliv: 21 Tot. Deliv '99 (‘99): 13,844 In/Disp. Cap:903,000 Units Pick Face Quant: 5,461 Units Heywood 81 84 Av. Miles Per Deliv: 136 Av. Deliv. Per Trip: 1.05 Av ULCs per Deliv: 21 Tot. Deliv '99: 19,909 In/Disp. Cap: 1,500,000 units Pick Face Quant: 10,110 units Magna Park 91 88 Av. Miles Per Deliv: 129 Av. Deliv. Per Trip: 1.05 Av ULCs per Deliv: 24 Tot. Deliv '99: 25,078 In/Disp. Cap:1,500,000 Units Pick Face Quant: 7,401 Units Daventry 72 72 Av. Miles Per Deliv: 136 Av. Deliv. Per Trip: 1.09 Av ULCs per Deliv: 22 Tot. Deliv '99: 16,054 In/Disp. Cap:1,000,000 Units Pick Face Quant: 10,110 Units Bridgewater 46 55 Av. Miles Per Deliv: 156 Av. Deliv. Per Trip: 1.11 Av. ULCs per Deliv: 21 Tot Deliv ‘99: 14,978 In/Disp. Cap: 851,000 units Pick Face Quant: 5,461 units Basildon 90 78 Av. Miles Per Deliv: 102 Av. Deliv. Per Trip: 1.07 Av ULCs per Deliv: 22 Tot. Deliv '99: 25,082 In/Disp. Cap:1,500,000 Units Pick Face Quant: 6,952 Units