Download
1 / 40
430 likes | 693 Views
Spatial Variability in Precision Agriculture. What is it? Precision n. The quality or state of being precise. Used or intended for precise measurement. Made for the least variation from a set standard. (Webster, 1995)

E N D
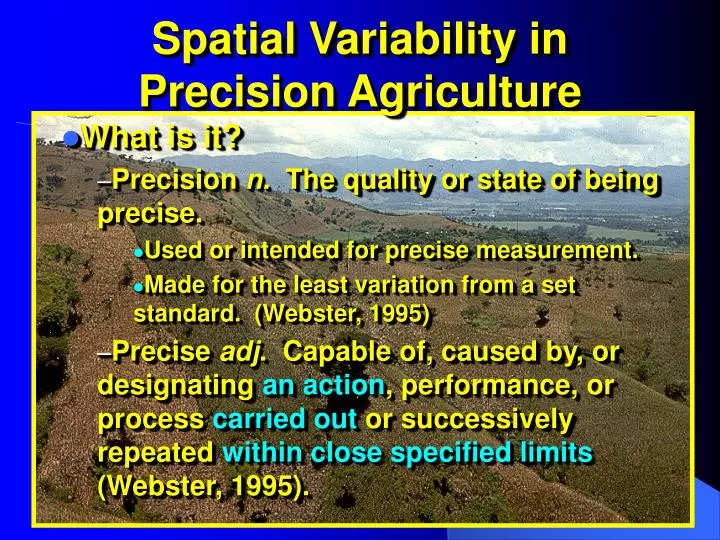
Spatial Variability in Precision Agriculture What is it? Precision n. The quality or state of being precise. Used or intended for precise measurement. Made for the least variation from a set standard. (Webster, 1995) Precise adj. Capable of, caused by, or designating an action, performance, or process carried out or successively repeated within close specified limits (Webster, 1995).
Precision Agriculture What is it? Precision in management? Knowing more precisely the size of fields, level of inputs (rates), yields, $ costs, and $ returns?
Precision Agriculture What is it? Management of production inputs in relation to more precisely delineated needs (Johnson, 1/18/01). Recognizes spatial variability of production needs within a population of production units, where production units are smaller than they used to be.
Spatial variability among production units. • What is the size of a production unit? • Depends on the enterprise. • Small dairy = single dairy animal. • Wagoner Ranch, TX = 7,000 – 8,000 acre wheat field. • Agronomic units = “fields”
Production Unit Size? By Farm?
Production Unit Size? 2-4 acre grids?
Spatial variability among production units. • What causes field delineation. • Natural boundaries. • Rivers • Rock out-crops • Political boundaries. • Roads • Survey units • Land ownership • Consolidation
Spatial variability among production units. • What causes field delineation. • Soil productivity appropriate to the crop (e.g. bottom land for alfalfa). • Size determined by land use • Government acreage restrictions (CRP) • Tees, fairways, greens • Size that is “convenient” to the operation for administering production inputs. • Cultivation • Planting • Harvesting (mowing) • Fertilizing • Irrigation • Etc.
Spatial variability (macro) for agronomic land use. • Inherent (natural). • Related to soil productivity and soil forming factors • Time • Parent material • Climate • Vegetation • Slope
Usually not acidic Usually acidic Soil acidity and Oklahoma rainfall
Spatial variability (macro) for agronomic land use. • Acquired (use induced). • Influence of historical crop production on soil properties. • Alfalfa vs. wheat for acidification and soil organic matter. • Fertilizer use and change in soil fertility (Garfield County).
Acquired spatial variability (micro). “Cow Pocks” in wheat pasture
Acquired spatial variability (micro). Ave = 47; CV = 30
Management Zones A C B
Plant Growth and Soil Nutrient Supply Relationships • Mitscherlich (1909) • “…increase in yield of a crop as a result of increasing a single • growth factor is proportional to the decrement from the • maximum yield obtainable by increasing the particular growth • factor.” • dy/dx = (A - y) c • Law of • “diminishing • returns” A-y for x1 and Dy1 Dy2 Yield (y) Dy1 x1 x2 Increasing level of growth factor (nutrient, x)
Plant Growth and Soil Nutrient Supply Relationships • Mitscherlich • Soil deficiency levels could be expressed as a “percent • sufficiency” 100 % of Maximum Yield or “Yield Possibility” 75 50 10 40 70 100 Soil Phosphate (P) or Potassium (K) Supply (soil test index)
Plant Growth and Soil Nutrient Supply Relationships • Mitscherlich • Soil Test Correlation and Calibration • Soil Test Percent Fertilizer • P IndexSufficiency P2O5 • 0 25 80 • 10 45 60 • 20 80 40 • 40 90 20 • 65+ 100 0
Plant Growth and Soil Nutrient Supply Relationships • Bray • “…as the mobility of a nutrient in the soil decreases, the amount of that • nutrient needed in the soil to produce a maximum yield (the soil nutrient • requirement) increases from a value determined by the magnitude of the yield • and the optimum percentage composition of the crop, to a constant value.” Bray mobile nutrient 100 % of Maximum Yield or “Yield Possibility” 75 50 10 40 70 100 Soil Phosphate (P) or Potassium (K) Supply (soil test index)
Plant Growth and Soil Nutrient Supply Relationships • Bray • For a nutrient that is 100 % mobile in the soil (NO3-N ?) • Soil nutrient • supply requirement = Yield X % nutrient in tissue • (Input requirement = harvest output or removal) • Idealized situation would be hydroponics nutrient • supplying system (no soil-nutrient interaction)
What Happens to Applied Nitrogen Fertilizer? SOIL REACTIONS AMMONIUM FERTILIZERS NITRATE NITROGEN AMMONIUM NITROGEN SOIL M ICROORGANISMS SOIL ORGANIC MATTER
What Happens to Applied Nitrogen Fertilizer? CROP UPTAKE NH3 AMMONIUM FERTILIZERS NITRATE NITROGEN AMMONIUM NITROGEN SOIL REACTIONS SOIL MICROORGANISMS SOIL ORGANIC MATTER
Plant Growth and Soil Nutrient Supply Relationships Wheat response to fertilizer N Bray mobile nutrient
Plant Growth and Soil Nutrient Supply Relationships • Bray Soil nutrient supply requirement = Yield X % nutrient in tissue • Bushel Wheat Requirement = (lb/bu) * % N • = 60 * 2.2 % N (13 % C.P.) • = 1.33 lb N/bushel • Assumes • 100 % efficiency in converting soil N to wheat grain N. • relatively constant N content • At 70 % efficiency, requirement is 1.33/.70 = 1.9 lb N/bu
Plant Growth and Soil Nutrient Supply Relationships • Bray Bushel Wheat Requirement = (lb/bu) * % N = 60 * 2.2 % N (13 % C.P.) = 1.33 lb N/bushel At 70 % efficiency and 13 % C.P., requirement is 1.33/.70 = 1.9 lb N/bu At 50 % efficiency and 15 % C.P., requirement is 1.53/.50 = 3.1 lb N/bu At 100 % efficiency and 11 % C.P., requirement is 1.1/1 = 1.1 lb N/bu
Nitrogen soil availability N2O and N2 Source and fate of nitrate (NO3-). Rainfall Denitrification - O2 NO3- NO3- H+ + O2 + NH4+ Leaching Nitrification NO3-
Nitrogen soil availability N2O and N2 Source and fate of ammonium (NH4+). Rainfall Denitrification - O2 Volatilization NO3- CEC (-) NO3- NO3- H+ + O2 + NH4+ Soil Organic Matter-N + OH- Leaching NH3 + H2O Mineralization NO3-
Nitrogen soil availability N2O and N2 Source and fate of ammonium (NH4+) Rainfall Denitrification - O2 immobilization Volatilization NO3- CEC (-) NO3- NO3- H+ + O2 + NH4+ NH3 Soil Organic Matter-N + OH- Leaching NH3 + H2O Mineralization NO3-
Plant Growth and Soil Nutrient Supply Relationships • Bray • Current Oklahoma field practice • Estimated yield in bu/acre (YG) * 2 lb N/bu = • Estimated N requirement • Estimated N requirement - soil test NO3-N = • Fertilizer N requirement. • Estimated topdress N = est.(Yield * %N) - • preplant and soil N supplied • sensor based goal • Estimated topdress N =k sensed yield and • sensed % N
Plant Growth and Soil Nutrient Supply Relationships N use efficiency = [100 (Nx - N0) grain N] / Nx applied