Download
1 / 52
540 likes | 799 Views
Overview of Supply Chain Re-engineering Process at Dow Corning Corporation. Presented at 2000 Supply-Chain World Conference Chicago, Illinois April 12, 2000 Timothy A. Troup, P.E. Supply Chain Specialist Dow Corning Corporation Midland, Michigan. Agenda. In the “Beginning”

E N D
Overview of Supply Chain Re-engineering Process at Dow Corning Corporation Presented at 2000 Supply-Chain World Conference Chicago, Illinois April 12, 2000 Timothy A. Troup, P.E. Supply Chain Specialist Dow Corning Corporation Midland, Michigan
Agenda • In the “Beginning” • Dow Corning Case Study - Widgets Supply Chain • Key Learnings & Recommendations
Dow Corning Corporation • Develops, Manufactures & Markets Silicones, Poly- • crystalline Silicon & Related Specialty Chemicals. • Products Are Used By Virtually Every Major Industry In The World. • $2.6B Sales (1999) • 5 Global Industry Business Units (IBUs) • 5,000 Products • 7,200 Active Patents Worldwide • 8,000 + Employees Worldwide • 45,000 Customers Worldwide • 25 Major Mfg Locations On All 5 Continents
DCC Time Line of Supply Chain - Progress Pre- 1990 1991- 1992 1993- 1995 1996- 1997 1998- 1999 1999- 2000 Functional Organization with Area Control 1st Dow Corning Business to Analyze Supply Chain - Little Impact 2nd Dow Corning Business with Dynamic Modeling Regional Pilot Supply Chain Study with Some Success, but limited in scope Major Global Supply Chain Project with Proven Process with PRTM & Dow Corning Supply Chain Operations Major Dow Corning Reorganization to Support Horizontal & Supply Chain Driven Organization
Where Are We Today? • WE’VE ADOPTED THE SUPPLY CHAIN COUNCIL’s • “SCOR” MODELAS OUR SC MODELING STANDARD • (PLAN / SOURCE / MAKE / DELIVER) • WE’VE ACQUIRED & LEARNED HOW TO UTILIZE • “PRTM's” SCANALYSIS METHODOLOGY • WE’VE GENERATED OUR OWNDOW CORNING • SPECIFIC METHODOLOGY& TOOL UPGRADES • WE’VE GAINEDSC ANALYSIS EXPERIENCEVIA • SEVERAL DOW CORNING SC ANALYSES
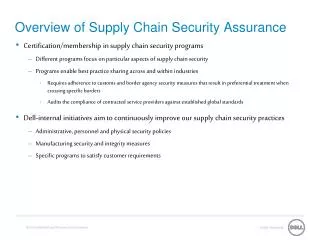
We Are Utilizing a “Process-Centered” Approach to Supply-Chain Management Supply-chain support elements must be present to achieve significant performance improvement Performance Targets and Benchmarks Operations Strategy • Value Proposition • Core Competencies • Make/Buy Decisions • Capacity Rationalization Delivery Performance / Quality Flexibility and Responsiveness Cost Assets Supply-Chain Management Processes Plan Source Make Deliver Organization and Decision-Making Systems and Tools Policies and Procedures Senior Management xxx xxxx xxxx xxxxx xxxxx Information Source:Pittiglio Rabin Todd & McGrath (PRTM)
Integrated Supply-Chain Management Links Each Business Entity in the Supply Chain Deliver The direct linkage of all a manufacturers product delivery processes to those of its customers and their customers and those of its suppliers and their suppliers Plan Plan Plan Plan “Manages supplier’ssupplier relationship” “Manages customerrelationship” “Manages supplier’srelationship” “Manages customer’s customer relationship” Plan Source Make Deliver Deliver Source Make Deliver Source Source Make Suppliers’Supplier Supplier Customer Customer’sCustomer Dow Corning Corporation (internal or external) (internal or external) Source: Supply Chain Council SCOR Model
First We Must Identify the Primary Supply Chain(s) of Interest From the Many “Threads” That Make up a Network, or “Chain of Chains” SOURCE MAKE DELIVER SOURCE MAKE DELIVER SOURCE MAKE DELIVER Source Make Deliver SOURCE MAKE DELIVER Multiple Production Operations within a Business Multiple Suppliers Multiple Customers Source: Supply Chain Council SCOR Model
The Focus of Supply Chain Management is to more effectively serve customers... seamless fabric of information flow, physical distribution flow, and cash flow for the benefit of the end Customer.
Case Study - Global Widgets Supply Chain (GWSC)
Supply-Chain Improvements Are Identified & Framed Using the SCOR Model in a Three Phase Approach Phase 1 — Diagnostic & Visioning Phase 2 Phase 3 1.3 Value Proposition 1.5 Basis of Competition Implementation Roll-out 1.1 Quantitative Dx Implementation of Best Practices and Systems Solutions Leveraged Benchmarking Using SCOR Metrics Rapid Roll-out of Success Across Business Gaps, Opportunities, Value of Closing Gaps Performance Goals and Phased Targets 1.2 Qualitative Dx 1.4 Visioning 1.6 Implementation Continuous Improvement and Successful, Sustainable Competitive Advantage Supply-Chain Maturity Assessment using SCOR Best Practices Fact-Based Implementation Plans Visioning Using SCOR Pilot Projects Pilot the Changes Obtain Measurable Results Identify the Need to Change Identify the Value of Change Source:Pittiglio Rabin Todd & McGrath (PRTM)
Supply-Chain Analysis & Re-engineering Steps • DIAGNOSIS (“AS IS” Supply-Chain) • Clearly Defined SC Scope & Critical Drivers • External Benchmarking • Value Proposition Evaluation • SC Mapping (Geographic (L-1), Process (L-2) & Key Metrics (L-2)) • SC WorkflowDecomposition Analysis • External Customer Interviews • VISIONING (“TO BE” Supply-Chain) • Identify Critical Supply-Chain Attributes • Define Strategic “Basis of Differentiation” • Define “TO BE” Supply-Chain Structural Components • Define “TO BE” Process & System Upgrades Required • Prioritize Re-engineering Projects / Initiatives • Project Chartering & Economic Analysis • IMPLEMENTATION (Re-engineering the Supply-Chain)
Supply-Chain Analysis & Re-engineering Focus • Benchmarking (Internal & External) • Work Flow Processes &Structural Assets • Visioning • Re-engineering Projects &Economic Impacts
Supply-Chain Analysis & Re-engineering Focus • Benchmarking (Internal & External) • Work Flow Processes &Structural Assets • Visioning • Re-engineering Projects &Economic Impacts
Three Primary Characteristics of Widgets Supply-Chain Were Identified & a Custom Population was Selected Avon Products BASF—Automotive Refinish BASF—Plastic Materials BASF—Agricultural Products Carpenter Technology—Steel Operations Dow Chemical—Global Ion Exchange Dow Chemical—Specialty Plastics Europe Dow Corning—Widgets GenCorp—Decorative & Building Products HP Inkjet Supplies Business—Cartridges HoltraChem—Chemical Warehousing & Distribution ICI—Paints/Decorative Johnson & Johnson—Korea Ltd. Kimberly-Clark—Away-From-Home Sector McNeil Consumer Products Modus Media International Sonoco Products—High Density Film Products Source Pittiglio Rabin Todd & McGrath (PRTM)
Summary SCORcard for Widget Business Supply-Chain Performance Versus Custom Population 0% – 20% 20% – 40% 40% – 60% 60% – 80% 80% – 100% Major Average Best- Key Perspectives Level 1 Metrics Opportunity Disadvantage or Median Advantage in-Class Delivery Performance to Request 99% 99% 95% Delivery Performance/Quality Order Fulfillment Lead Time (MTS) 1.0 days 1.0 days 3.6 days Order Fulfillment Lead Time (MTO) 10.3 days 10.3 days 25.9 days Customer-facing Perfect Order Fulfillment 99% 99% 88% 3 days Upside Flexibility 3 days 30 days Flexibility &Responsiveness 48 days Supply-Chain Response Time (MTS)* 48 days 89 days 57 days Supply-Chain Response Time (MTO)* 57 days 110 days 6.8% Supply-Chain Management Cost 6.8% 11.4% Cost $305K $175K Value Added per Employee $305K Internal-facing 33 days Total Inventory Days of Supply 33 days 57 days 43 days Assets 74 days Cash-to-Cash Cycle Time 43 days 3.1 turns 1.8 turns Net Asset Turns 3.1 turns Europe Asia Americas Source:Pittiglio Rabin Todd & McGrath (PRTM)
Widgets Initial Value Proposition — Europe Delivery Performance/Quality Customer-facing Flexibility &Responsiveness Cost Internal-facing Assets Europe Source:Pittiglio Rabin Todd & McGrath (PRTM)
Total Supply-Chain Management Cost — Europe … as several order management cost elements are higher than average … Material acquisition cost, however, is best-in-class … and inventory carrying costs are high due to opportunity cost Supply-chain management cost is substantially higher than best-in-class… % 12.2% 11.4% Total Supply-Chain Manage-ment Cost as % of Revenue 6.8% Definition: Total supply-chain management cost is the sum of supply-chain related MIS, Finance and Planning, Inventory Carrying, Material Acquisition, and Order Mgmt *Best-in-class is calculated based on those reporting data for all elements
13.0% 12.2% 11.4% 8.3% Total Supply-ChainManagement cost as a % of revenue MIS Finance and Planning Inventory Carrying Material Acquisition Order Management 6.8% Asia Definition: Total supply-chain management cost is the sum of supply-chain related MIS, Finance and Planning, Inventory Carrying, Material Acquisition, and Order Management Total Widget Supply-Chain Management Cost
Cash-to-Cash Cycle Time Cash-to-Cash cycle time for U.S. is best-in-class; while Asia and Europe are higher than average … … largely due to high receivables … 100 100 87 81 87 74 80 71 75 53 Cash to Cash Cycle Time, Days Days of Sales Outstanding 60 46 43 44 50 37 40 25 20 0 0 Best-in- Average Europe US Asia Best-in- Average Europe US Asia Class* Class* Payables for production material are average for Europe and U.S., but approaching best-in-class for Asia … and average inventory performance 80 100 88 61 57 80 54 60 Average Payables Period for Production Materials, Days 60 60 Total Inventory Days of Supply 36 45 45 33 40 43 40 20 20 0 0 Best-in- Average Europe US Asia Best-in- Average Europe US Asia Class* Class Definition: Cash-to-Cash cycle time is inventory days of supply + days sales outstanding—average payment period for materials (time it takes for a dollar to flow back into a company after its been spent for raw materials) *Best-in-class is calculated based on those reporting data for all elements
Examining performance by supply-chain process highlights opportunities in Plan and Deliver in Europe… Material Acquisition Cost Total Supply-Chain ResponseTime (MTO) Asset Turns Total Supply-Chain ResponseTime (MTS) Average Payment Period Delivery to Request Date OVERALL Perfect Order Fulfillment SOURCE Order Fulfillment LT (MTO) Total Supply-Chain Cost Order Fulfillment LT (MTS) PLAN Inventory Carrying Cost Delivery to Request Date Inventory Days of Supply DELIVER Supply-Chain-Related Finance and Planning Cost Supply-Chain-Related MIS Cost Sourcing Lead Time (MTO) Cash-to-Cash Cycle Time Order Fulfillment LT (MTS) Forecast Accuracy ($) Order Mgt. Cost Sourcing Lead Time (MTS) Days Sales Outstanding Sourcing Lead Time (MTS) Value-Added Productivity/Employee Widget Div. #1 Total Supply-Chain ResponseTime (MTS) Widget Div. #2 Total Europe Percentile 100 World Class 88 Upside Production Flexibility by 20% Source/Make Cycle Time (MTO) Advantage 75 63 Source/Make Cycle Time (MTS) MAKE 50 Parity Upside Production Flexibility by 20% Source/Make Cycle Time (MTS) 38 Disadvantage 25 13 Value-Added Productivity/Payroll Dollar Major Opportunity 0 Source: Pittiglio Rabin Todd & McGrath (PRTM)
Supply-Chain Analysis & Re-engineering Focus • Benchmarking (Internal & External) • Work Flow Processes &Structural Assets • Visioning • Re-engineering Projects &Economic Impacts
European Supply-Chain Diagnostic Activities Supply-Chain Process Workshops Benchmarking • Overall supply-chain configuration (SCOR Level 2) • Business Process Elements (SCOR Level 3) • Deliver — Order Management • Deliver — Transportation and Warehouse Management • Make • Source • Plan • Div. #1 and Div. #2 responses for “customer-facing” metrics • Overall European data for “internal- facing” metrics Customer Interviews Customer #1 — Belgium Customer #2 — UK (Distributor) Customer #3 — Holland (Distributor) Customer #4 — UK (Direct) Customer #5 — Holland (Direct) Customer #6 — UK (Direct) Customer #7 — UK (Direct) Findings Internal Interviews Division #1 Division #2 Xxx xxxxxxxxx Xxx xxxxxxxxx xxx xxxxxxxxx Xxx xxxxxxxxx Xxx xxxxxxxxx Xxx xxxxxxxxx xxx xxxxxxxxx Xxx xxxxxxxxx Xxx xxxxxxxxx Xxx xxxxxxxxx Xxx xxxxxxxxx Xxx xxxxxxxxx Xxx xxxxxxxxx Xxx xxxxxxxxx Xxx xxxxxxxxx
Major European Findings From Interviews and Workshops by Supply-Chain Element Plan • Lack of organized forecasting process • Finished goods inventory planning not integrated and responsibility rests at the lowest levels of the organization • Too many planners Source Make Deliver • Few Joint Service Agreements in place • Apparent overlap of purchasing responsibilities • Manual scheduling techniques • Complicated scheduling and inventory mgmt due to imbalance between machining and packaging lines • Local warehouse structure not delivering expected benefits • Multiple order entry points adding costs without value • Lack of corporate guidance to RSC’s results in unnecessary complexity
Supply-Chain Analysis & Re-engineering Focus • Benchmarking (Internal & External) • Work Flow Processes &Structural Assets • Visioning • Re-engineering Projects &Economic Impacts
GWSC Visioning Process Visioning Team Global Widget Business Other Xxx xxxxxxxx Xxx xxxxxxxx Xxx xxxxxxxx Xxx xxxxxxxx Xxx xxxxxxxx Xxx xxxxxxxx Xxx xxxxxxxx Xxx xxxxxxxx Xxx xxxxxxxx Tim Troup Scott Barber Consultant #1 Consultant #2 Consultant #3 Xxx xxxxxxxx Xxx xxxxxxxx Xxx xxxxxxxx Xxx xxxxxxxx Strategic Visioning Define Plan/Source/Make/Deliver Requirements Necessary to Serve 4 Product Market Segment Categories Combine 11 Product Market Segments into 4 Categories Based on Supply Chain Commonality Review Customers, Competitors, and Widget Goals Define Customer-Facing Requirements for 4 Product Market Segment Categories Tactical Visioning Recommend Supply-Chain Changes by Geography and Plan/Source/Make/Deliver Review “as-is” Supply- Chain Configurations for Each Area Develop “to-be” Supply-Chain for Each Area Group Recommendations into Implementation Projects
Widgets Consumer / Trades Market Segment “Basis of Competitive Differentiation” = how we need to compete to be successful (1) Area = Americas, Asia, or Europe—highest level Region = As defined by OU structure, except Europe is considered a region Sub-region = Grouping by language requirements or size Local = Within a country, 3 – 4 hour transportation time (1) This attribute is required to be at least in the advantage category for the North America Market
MAKE Sites (6) Bangor, Belgium Dusseldorf, Germany Roma, Italy Cordina, Germany Fasday, UK PTC, Germany Warehouses (9+45) Bangor, Belgium Copersigen, Belgium Wochester, UK Madrid, Spain Roma, Italy Baste, France Manheim, Germany Cordina, Germany Dusseldorf, Germany 45 Machinos, Germany Order Entry Sites (8) La Notal, Belgium Vienna, Austria Dusseldorf, Germany Cordina, Germany Roma, Italy Moisle, France Madrid, Spain Mersey, UK MAKE Sites (2) Bangor PTC Site, TBD Warehouses (1+) Copersigen Order EntrySites (3 to 1) Roma Europe — The Future (2 – 5 years)
Supply-Chain Analysis & Re-engineering Focus • Benchmarking (Internal & External) • Work Flow Processes &Structural Assets • Visioning • Re-engineering Projects &Economic Impacts
Project Definition Tasks Refine Project Charters Define Projects (from Visioning) Create Project Charters Build Implementation Milestones Load Results into Business Health Model Perform Economic Analysis
The Widgets Visioning Team Defined the Following Implementation Projects Required to Attain the Vision = most impact = less impact Area of Impact Geographical Supply-Chain Project (Ranked by priority) Americas Europe Asia Plan Source Make Deliver 4 “Make” sites consolidation 5 Warehousing and distribution consolidation 1 Demand supply management 6 Order management and supporting business process consolidation 3 Supply strategy 2Supply-chain organization and metrics 11 Japan Widgets supply-chain reengineering 9 Business brand and product line rationalization 7 Consolidate procurement * 8 Direct order entry from distributor/customer 10 Application of global purchasing methodologies to current and new products * * Included in global procurement initiative
Project # 4: Global Widget Business “Make” Site Consolidation Implementation Structure • Purpose: • To reduce the present number of Global Widget Business MAKE sites globally to the number needed to meet the Widget Businesses’ goals • Needs: • Too many MAKE and/or packaging sites in the Widgets business have resulted in: • RONA that is well below target • Below optimized capacity utilization rates and manufacturing efficiencies • Expected Results: • Global reduction in MAKE sites from XX to X • Achieve a (Fixed/Variable) Cost Savings of $29,999 M by year end 2000 • Achieve DSI Reduction of X Day(s) by year end 2000 • Achieve a Working Capital Reduction of $2,222 M which realizes an opportunity cost avoidance of $555 M (@ XX% C of C) by year end 2000 • Improve customer facing metrics (Delivery Performance and Perfect Order Fulfillment) to BIC • A major step change is achieved towards Global Products and Global MAKE processes • Timeline: • July 1998 to Q4 1999 Ms. Jones Mr. Lue Global Management Team(4 – 5 People, 20% Commitment) Mr. Brown Mr. Smith SC Leader Area Teams (4 – 5 People, 40 – 60% Commitment) Mnf’ing (Bulk) Pack’ging Ec Eval Mnf’ing Mr. Lue Process Eng Logistics HR Mnf’ing (Bulk) Mnf’ing (Bulk) Pack’ging Pack’ging Ec Eval Mnf’ing Ec Eval Mnf’ing Europe Team Ms. Jones Mr. Brown Process Eng Process Eng Logistics Logistics Asia Team Americas Team HR HR
Make Consolidation Milestones July 98 Aug 98 Sept 98 Oct 98 Nov 98 Dec 98 Q1 99 Q2 99 Q3 99 Q4 99 Q1 2000 Project Planning Define Metrics Analysis Phase European Analysis Complete Americas and Pacific Analyses Complete Project Implementation European Implementation Complete Americas Implementation Complete Pacific Implementation Complete Confirm Project Improvements
Economic Analysis — Total of All Widget Projects Fixed and Variable Cost Savings due to Widgets projects $000s Fixed cost savings from consolidation * Fixed: $30,100 Other savings not included above Fixed: $6,108 Inventory** · Variable: $3,256 Transportation and raw material efficiencies Variable: $5,181 · Total annual savings: $44,645 Working Capital Reduction $000s Working Capital Reduction @ FASC (one-time) $30,630 Inventory Cost Avoidance @ 15% C of C (annual) $9,095 Cost and Capital to Implement Widgets projects $000s Implementation Costs: $29,000 Cost: (ex. Severance, Lease, Relocation) $9,000 Capital: (ex. New and/or Relocation Assets) One-Time Charge for Widgets Change: $38,000 * Contains inventory expense items of space/racks/equipment, personnel, inventory planning and management, record keeping, inventory counting, plant floor space, and lot inspections plus other infrastructure savings ** Contains inventory expense items of Fixed: Insurance/Tax/IT costs/Assoc. Tech Support, Variable: Damage/Shrinkage/Obsolescence/Scrap/Rework
EE Methodology • Main focus: Large reduction of Fixed Expenses in a short time frame • Target cost savings: $20 million in 1999, building up to $50 million per year by YE 2000 • Evaluation tool: • Income statement and balance sheet projections Þ Business Unit Health model • Cash Flow analysis could be applied to provide a longer term perspective
Basis of Competition • Review and agree on how Widget Business will supply its customer base • Review and prioritize implementation projects required to realize the vision • Confirm that Widget Business has resources required to complete implementation
Key Supply-Chain Learnings & Recommendations
Key Issues • Defining Scope • Assigning Players • Keeping to “Tight” Schedule • Participation of Key Players • Moving Forward on Projects • Sub-Optimization • Coordination of Efforts
What Have We Learned To-Date? • Well Defined & Integrated IBU Strategies • Are Critical Precursors To Optimal SC • Definition & Operation . . . . • - Global Industry Business Unit Strategy(s) • - Commercial Strategy(s) • - Product Line Strategy(s) • - Supply Chain Strategy(s)
IBU Strategic Framework Mission, Vision, Goals, Strategy, Strategic Initiatives, SCOREcard CommercialStrategies(4-P’s), Industry SCOREcard Harmonization Supply Chain Strategies, Goals & SC SCOREcard (Plan, Source, Make, Deliver) Product Line Strategies, Goals & PL/BPU SCOREcard (1) IBU strategy is the sum of (and drives) commercial strategy, product line strategy, and supply chain strategy. (2) Commercial strategies lead product line strategy and supply chain strategy. (3)IBU balanced SCOREcard addresses key stakeholders and includes key metrics from commercial, PL and SC SCOREcards.
What Have We Learned To-Date? • Supply-Chain Cost Reduction & Optimization • Opportunities Are In The $MMs For DCC • ($150MM By 2001) • Supply-Chain Re-engineering “Is Not” Free • Rapid SC Analysis is “Resource / SupportIntensive” • Staffing & Implementation of Supply-Chain • Initiatives Has Been Our Biggest Challenge
What Have We Learned To-Date? • “Suboptimization” is a Legitimate Issue • (By Business / IBU & By Geography) • Many of DCC’s Key SC Links Are “Shared” • Many SC Re-engineering Opportunities are “Multi-Business / IBU” in Breadth • Significant Insights Result From Infrastructure • “Mapping” & Supply Chain “Benchmarking”
What Have We Learned To-Date? • Ultimately, Consolidation / Elimination of Supply-Chain Costs Is Relatively Easy ... • The challenge lies in re-engineering oursupply-chain configurations & processes so thatwe can optimize our Supply Chain Management costs & ensure we provide our targeted levelsof customer service. • + • Project Implementation
Concerns going forward... • Keeping Implementations on track with organization changes • Rapid staffing of projects • Stopping Supply Chain Improvement too soon (Remember the Customer!)
“Best in Class” Companies Follow a “Process- Centered” Approach to Supply-Chain Management Supply-chain support elements must be present to achieve significant performance improvement Performance Targets and Benchmarks Operations Strategy • Value Proposition • Core Competencies • Make/Buy Decisions • Capacity Rationalization Delivery Performance / Quality Flexibility and Responsiveness Cost Assets Supply-Chain Management Processes Plan Source Make Deliver Organization and Decision-Making Systems and Tools Policies and Procedures Senior Management xxx xxxx xxxx xxxxx xxxxx Information Source: Pittiglio Rabin Todd & McGrath (PRTM)