Download
1 / 4
370 likes | 1.19k Views
Interpreting Visual Information. CCSS RI.4.7- Interpret information presented visually, orally, or quantitatively (gramps, charts, diagrams) and explain how the information contributes to an understanding of the text in which it appears. .

E N D
Interpreting Visual Information CCSS RI.4.7- Interpret information presented visually, orally, or quantitatively (gramps, charts, diagrams) and explain how the information contributes to an understanding of the text in which it appears.
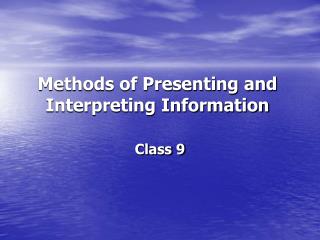
What are some places or books that we might see visual displays?
Read this text and then look at the bar graph. Think about how the information it shows adds to what the text is telling you.
Now look at this table. It brings together facts from the text and the graph. Using all the information provided to you, within the text and the graph, it gives you a pretty good idea of what a fish tank looks like. Most informational text will have visual displays. Studying them and understanding them will help you fully understand the text.