Download
1 / 15
150 likes | 255 Views
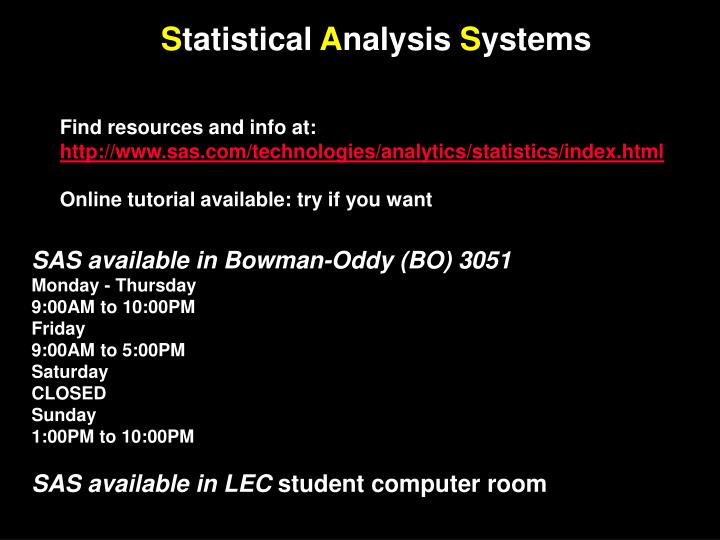
S tatistical A nalysis S ystems. Find resources and info at: http://www.sas.com/technologies/analytics/statistics/index.html Online tutorial available: try if you want. SAS available in Bowman-Oddy (BO) 3051 Monday - Thursday 9:00AM to 10:00PM Friday 9:00AM to 5:00PM Saturday

E N D
Statistical Analysis Systems Find resources and info at: http://www.sas.com/technologies/analytics/statistics/index.html Online tutorial available: try if you want SAS available in Bowman-Oddy (BO) 3051 Monday - Thursday 9:00AM to 10:00PM Friday 9:00AM to 5:00PM Saturday CLOSED Sunday 1:00PM to 10:00PM SAS available in LEC student computer room
Expect this to be a little confusing, takes a while to get used to Take example programs and modify to your needs Work in groups Use Help function. Examples of syntax etc…… available
Following a flaming snowmobile crash, one statistician asked the other if she was OK. The second said “Well, my hair’s on fire and my toes are frostbitten, but on average I feel pretty good." Three statisticians go deer hunting with bows and arrows. They spot a big buck and take aim. One shoots and his arrow flies off 3 meters to the right. The second shoots and her arrow flies off 3 meters to the left. The third statistician jumps up and down yelling, "We got him! We got him!"
SAS 3 main windows Program editor: write edit program, can also do in Word or other Log: Output of what was done, red=where you went wrong Output: shows results of what you told SAS to do
Save Excel spreadsheet as *.csv (comma delimited file) Possible to save and import other formats, but you are on your own to figure out code Remove column headings from .csv file Remember which columns are numerical and which are not
Beginning of sample program First task, read in data, make sure it’s OK! ;ends a line $ for non num , delimited file data start; infile'C:\Documents and Settings\cmayer3\My Documents\research\sea grant prop 2003\05 data\all PAM Oneida data 05.csv'dlm=','DSD; input day $ tank $ sub $ measment $ num light $ zm $ P $ Invert $ F Fm Yield ETR PAR; options ls=200; if zm='n'thendelete; procsort; by day measment light zm P Invert; procprint; run; Reads in file Defines, names columns Set line size to 200- wide easier with < Delete some obs, note ‘ ‘ sort procedure- very imp Prints to output window, check
data start; infile'C:\Documents and Settings\cmayer3\My Documents\research\sea grant prop 2003\05 data\all PAM Oneida data 05.csv'dlm=','DSD; input day $ tank $ sub $ measment $ num light $ zm $ P $ Invert $ F Fm Yield ETR PAR; options ls=200; if zm='n'thendelete; procsort; by day measment light zm P Invert; procprint; data tanks; set start; procsort; by tank day measment sub light P Invert; procmeansnoprint; by tank day measment sub light P Invert; var F Fm Yield ETR PAR; outputout=one mean=F Fm Yield ETR PAR; procprint; run; Any name you want New data step, read in ‘start’ Data must be sorted before other procedure can be done Calc means by different categories Variables for which you calc means Define the output dataset and look at it in output window Name mean variables, same or diff than original Any name you want
data start; infile'C:\Documents and Settings\cmayer3\My Documents\research\sea grant prop 2003\05 data\all PAM Oneida data 05.csv'dlm=','DSD; input day $ tank $ sub $ measment $ num light $ zm $ P $ Invert $ F Fm Yield ETR PAR; options ls=200; if zm='n'thendelete; procsort; by day measment light zm P Invert; procprint; data tanks; set start; procsort; by tank day measment sub light P Invert; procmeansnoprint; by tank day measment sub light P Invert; var F Fm Yield ETR PAR; outputout=one mean=F Fm Yield ETR PAR; procprint; data two; set one; options ls=200; procsort; by day measment sub light P Invert; procmeansnoprint; by day measment sub light P Invert; var F Fm Yield ETR PAR; outputout=allfact mean=F Fm Yield ETR PAR stderr=eF eFm eYield eETR ePAR; procprint; run; Read in means that you made before Take means of means, exp: daily then weekly means or plot then forrest means Calc stderr (later), std, other & give name
data start; infile'C:\Documents and Settings\cmayer3\My Documents\research\sea grant prop 2003\05 data\all PAM Oneida data 05.csv'dlm=','DSD; input day $ tank $ sub $ measment $ num light $ zm $ P $ Invert $ F Fm Yield ETR PAR; options ls=200; if zm='n'thendelete; procsort; by day measment light zm P Invert; procprint; data tanks; set start; procsort; by tank day measment sub light P Invert; procmeansnoprint; by tank day measment sub light P Invert; var F Fm Yield ETR PAR; outputout=one mean=F Fm Yield ETR PAR; procprint; data two; set one; options ls=200; procsort; by day measment sub light P Invert; procmeansnoprint; by day measment sub light P Invert; var F Fm Yield ETR PAR; outputout=allfact mean=F Fm Yield ETR PAR stderr=eF eFm eYield eETR ePAR; procprint; data seven;set one; options ls=120; if day='initial' then delete; if measment='actinic' then delete; if measment='ambient1' then delete; if measment='lightcur' then delete; if sub='sediment' then delete; run; Delete some obs, note ‘ ‘
data one; infile'C:\Documents and Settings\cmayer3\My Documents\research\Oneida\Benthos till 2001.csv'dlm=','DSD; length date $ 50 site $ 50 other $ 50; input date $ year month $ site $ chir volchir pupae olig iso amph leech snail dsnail clam dclam lzm dzm cerat trich odonate megal coleop hemip odipt ostra bryoz nem plan mite ephem nematom stonefly other $; procsort; by year month; procprint; data two; set one; options nocenter ps=30 ls=250; insect=odonate+megal+coleop+hemip+stonefly+cerat+trich+ephem; drop odonate megal coleop hemip odipt ostra bryoz dclam dsnail stonefly dzm lzm other olig nematom nem mite ; if year<1975thendelete; procprint; data three; set two; dchir=chir/0.024025; dpupae=pupae/0.024025; diso=iso/0.024025; damph=amph/0.024025; dleech=leech/0.024025; dsnail=snail/0.024025; dclam=clam/0.024025; dinsect=insect/0.024025; procprint; run; Create new variable by + others can – x……… Get rid of columns (variables) (not obs as w/ delete Create new variables
IF Then statements =, GE, LE, others Very useful Can do in Excel too Creating new var based on category, useful, many options for big data sets. data nine; set deptstat; if depth='deep'then dpchir=chirm; if depth='deep'then dpiso=isom; if depth='deep'then dpamph=amphm; if depth='deep'then dpleech=leechm; if depth='deep'then dpsnail=snailm; if depth='deep'then dpclam=clamm; if depth='deep'then dpinsec=insecm; if depth='shallow'then schir=chirm; if depth='shallow'then siso=isom; if depth='shallow'then samph=amphm; if depth='shallow'then sleech=leechm; if depth='shallow'then ssnail=snailm; if depth='shallow'then sclam=clamm; if depth='shallow'then sinsec=insecm; procprint;
data eleven; set ratios; if year=1977then schir=1718.90; if year=1977then siso=58.7746; if year=1977then samph=129.053; if year=1977then sleech=12.3406; if year=1977then ssnail=148.714; if year=1977then sclam=121.314; if year=1977then sinsec=13.0336; procprint; data new; No ‘’ for numerical values Defining a variable as a constant
data new; infile'C:\Documents and Settings\cmayer3\My Documents\research\Oneida\book chapter\annual means.csv'dlm=','DSD; input year msecchi mavtemp mbotdo mchla msrp mtp; data new2; merge eleven new; by year; procprint; data twelve; set new2; ratchir=schir/(dpchir+0.17); ratiso=siso/(dpiso+0.17); ratamph=samph/(dpamph+0.17); ratleech=sleech/(dpleech+0.17); ratsnail=ssnail/(dpsnail+0.17); ratclam=sclam/(dpclam+0.17); ratinsec=sinsec/(dpinsec+0.17); if year<1992then mussel=0; if year ge 1992then mussel=1; procprint;
data two; infile 'C:\Documents and Settings\cmayer3\My Documents\research\sea grant prop 2003\05 data\PP & fluor.csv' dlm=',' DSD; input day $ tank $ sub $ measment $ light $ zm $ P $ Invert$ NPP RSP GPP; procsort; by tank day sub light zm P Invert; procprint; data three; merge two one; by tank day sub light zm P Invert measment; procprint; data four; set three; if measment ne 'ambient' then delete; if day='initial' then delete; if day='middle' then delete; if sub='zm' then delete; procprint; data five; set four; procsort; by day sub light zm P Invert; procplot; by day sub light zm P Invert; plot ETR*NPP='*'; plot ETR*GPP='@' / overlay; Plot procedure
Now run sample program & look at log and output Export output to Excel Exprot printout to Word to make look pretty