Download
1 / 52
520 likes | 615 Views
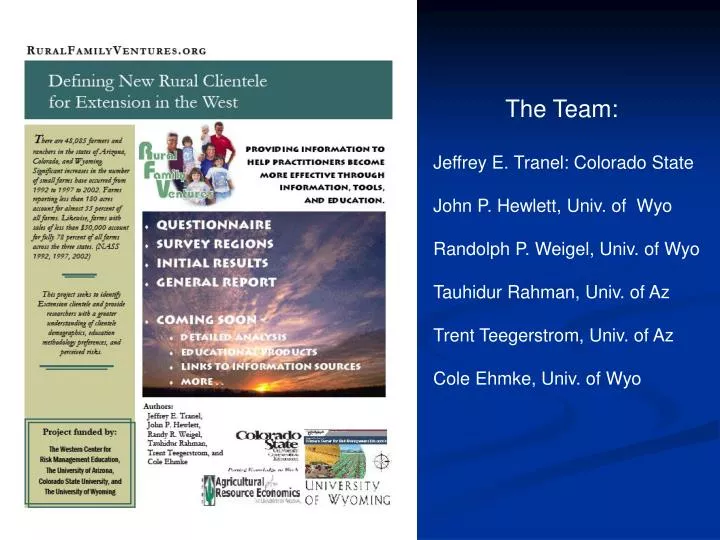
The Team: Jeffrey E. Tranel: Colorado State John P. Hewlett, Univ. of Wyo Randolph P. Weigel, Univ. of Wyo Tauhidur Rahman, Univ. of Az Trent Teegerstrom, Univ. of Az Cole Ehmke, Univ. of Wyo. Presentation Outline. Response Table Demographics

E N D
The Team: • Jeffrey E. Tranel: Colorado State • John P. Hewlett, Univ. of Wyo • Randolph P. Weigel, Univ. of Wyo • Tauhidur Rahman, Univ. of Az • Trent Teegerstrom, Univ. of Az • Cole Ehmke, Univ. of Wyo
Presentation Outline • Response Table • Demographics • Reasons for Involvement in the rural family ventures • Sources of Risk • Vulnerability Assessment • Information Sources and Preferences • The Role of Cooperative Extension • Resource Management • Income Status
Survey- Timeline and Methodology - • 8-page survey instrument developed by RFV Team. • Sample was drawn by USDA-NASS. • Based on population density of the target population and geographic distribution • Surveys were executed following a modified Dillman method. • First mailing = April 25 Telephone session #1 = May 22-26 • Reminder postcard = May 3 Telephone session #2 = June 15-22 • Second request = May 11SAS data set available = June 30 April 25, 2006 May 3, 2006 May 11, 2006 May 22, 2006 June 15, 2006 June 30, 2006 Time
Demographics… Operator 1 11% = 35-44 30% = 45-54 30% = 55-64 26% = 65+ 14% = High School 8% = Trade School 17% = 2yr Degree 22% = 4yr Degree 14% = Grad Degree
Demographics… Operator 2 17% = 35-44 32% = 45-54 30% = 55-64 15% = 65+ 36% = High School 6% = Trade School 19% = 2yr Degree 22% = 4yr Degree 11% = Grad Degree
Demographics… Distribution of “Operators” by race ? Operator 1 Operator 2
Demographics… How long have you lived on the property ?
Demographics… How long have you lived in the community ?
Demographics… How rural is most of the property managed by this operation?
Demographics… Is the primary residence located on the property ?
Demographics… How far is the property (headquarters) from the nearest “metro area”?
Demographics… Off property job? Yes or No
Demographics… How far does the individual who travels farthest commute to work?
Reasons for Involvement… How long do you expect to manage your property?
Sources of Risks… Ranking of Sources of Risks (Most Important)
Vulnerability Indicators of Rural family Business… I am comfortable with the way I handle uncertainty in my business environment
Vulnerability Indicators of Rural family Business… I am optimistic about the future of my business
Vulnerability Indicators of Rural family Business… I am always one of the first in my industry to try new technologies or production strategies
Vulnerability Indicators of Rural family Business… I am confident in my ability to deal with the changes that are taking place in the business environment
Vulnerability Indicators of Rural family Business… Business tasks must come before family/personal time
Vulnerability Indicators of Rural family Business… Today’s ranchers and farmers are at the mercy of outside forces so the best you can do is to adjust to the situation
Vulnerability Indicators of Rural family Business… Ranchers and farmers today must be sensitive to the environment by reducing the use of agricultural chemicals on their land
Information Sources and Preferences… What are your currently in use most preferred sources of information ?
Information Sources and Preferences… Of the information sources you use, please indicate how they could be improved ?
Information Sources and Preferences… In what form do you prefer to receive information?
The Role of Cooperative Extension… Have you ever received information from Cooperative Extension? New Extension Clientele 22.94%
The Role of Cooperative Extension… Has anyone from the operation participated in a Cooperative Extension program (except 4-H)? 17.66%
The Role of Cooperative Extension… Have any immediate family members participated in 4-H in the last two years? 18.74%
The Role of Cooperative Extension… Have any operators used any University services besides Cooperative Extension ? 19.77%
Resource Management… Acres of Land Managed ?
Resource Management… Sources of water on the land (owned + leased) you manage?
Resource Management… A river, stream, pond, or other surface waterway on/bordering the property you manage?
Resource Management… Do you use chemicals to control weeds on your property?
Resource Management… Do you have a current chemical applicators license?
Resource Management… Do you produce any commodities sold as organic, certified organic, all natural, chemical…indicating a specialty market?
Resource Management… Distribution of Livestock
Resource Management… How many months per year do you usually graze animals on your pasture?
Resource Management… Do you use a grazing management system to rotate animals through two or more pastures?
Resource Management… If Yes, then how many pastures?
Resource Management How much of your annual pasture production do your animals typically eat?
Income Status… What type best describes your operation in 2005 ?
Income Status… Size of farm/ranch based on gross farm income in 2005
90% 80% 70% 60% 50% 40% 30% 20% 10% 0% 0% - 20% 21% - 40% 41% - 60% 61% - 80% 81% - 100% Farm’s contribution to household income?
Primary Source of Income in 2005 For Number of Respondents Grain and oilseed farming 52 Vegetable and melon farming 13 Greenhouse, nursery, and floriculture 7 Hay Farming 400 Other crop farming 27 Tourism and recreation 20 Hunting and fishing 13 Cattle Beef 698 Cattle Feedlots 10 Dairy cattle and milk production 9 Hog and pig production 20 Sheep and goat production 125 Aquaculture and other animal production 28 Specialty Products 27 Other 820 Income Status… Primary Source of Income for this operation in 2005 ?