Download
1 / 15
150 likes | 299 Views
The Balance Sheet. Crow River Investment Club May 13, 2003. References. Starting and Running a Profitable Investment Club – Thomas E. O’Hara Kenneth S. Janke, Sr. The Motley Fool Investment Workbook A Balance Sheet (in this case, Lowe’s) www.investorwords.com. Agenda. Definitions

E N D
The Balance Sheet Crow River Investment Club May 13, 2003
References • Starting and Running a Profitable Investment Club – Thomas E. O’Hara Kenneth S. Janke, Sr. • The Motley Fool Investment Workbook • A Balance Sheet (in this case, Lowe’s) • www.investorwords.com
Agenda • Definitions • What is a balance sheet? • What do the terms mean? • Analysis • What do I look for?
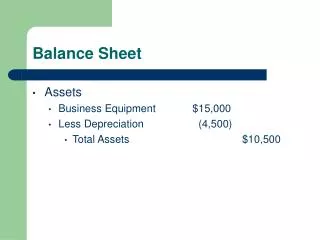
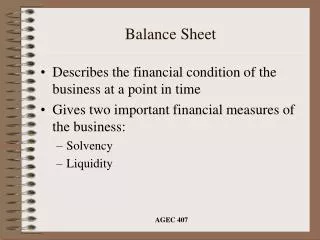
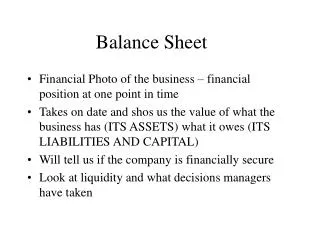
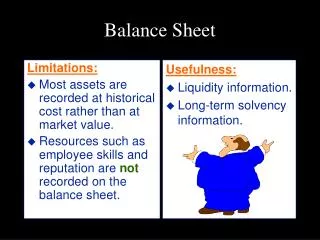
What is it? • Reports the financial condition of a company at a specific point in time • Required to report every three months • Three key areas: • Assets (What it owns) • Liabilities (What it owes) • Shareholders’ equity • Assets = Liabilities + Shareholders’ Equity
Basic Terms - Assets • Current Assets • Can be turned into cash quickly (within 12 months) • Examples • Cash, investments • Accounts Receivable (Bills due to the company) • Inventories • Interest payments on cash in the bank • Fixed Assets • Also long-term assets, property, plant, and equipment • Depreciation Growth in these areas should generally not outpace sales
Assets Example - LOW Current Assets: FY02 FY01 Cash and Cash Equivalents $853 $799 Short Term Investments $273 $54 Accounts Receivable – Net $172 $166 Merchandise Inventory $3968 $3611 Deferred Income Taxes $58 $93 Other Current Assets $244 $197 Total Current Assets $5568 $4920 Property (Less Accumulated Depreciation) $10352 $8653 Long-Term Investments $29 $22 Other Assets $160 $141 Total Assets $16109 $13736
Basic Terms – Liabilities • Current Liabilities • Cash the company must pay in the next 12 months • Examples • Accounts Payable (Bills the company owes) • Lease payments, short-term loans • Accrued Taxes • Accrued wages, interest, and other expense • Long-term Liabilities • Debt due in the years ahead vs. the current year
Liabilities Example - LOW Current Liabilities: FY02 FY01 Short Term Borrowings $50 $100 Current Maturities of LT Debt $29 $59 Accounts Payable $1943 $1715 Employee Retirement Plans $88 $126 Accrued Salaries and Wages $306 $221 Other Current Liabilities $1162 $796 Total Current Liabilities $3578 $3017 LT Debt (Excluding Current Maturities) $3736 $3734 Deferred Income Taxes $478 $305 Other LT Liabilities $15 $6 Total Liabilities $7807 $7062
What’s good? Plenty of cash Non-cash current assets that are dropping Rising current liabilities (unpaid bills for which cash is on hand) It’s better if the company is holding onto cash as long as possible What’s bad? Rising Inventories Rising receivables So what?
Basic Terms – Shareholders’ Equity • Represents the ownership of the company • Common Stock • Preferred Stock • Surplus • Capital or Paid-in surplus • Retained Earnings or Earned Surplus • Prepaid Expenses or deferred charges • Intangible Assets • Reserves for contingencies
Shareholders’ Equity Example - LOW Shareholders’ Equity: FY02 FY01 Preferred Stock - $5 Par Value, none issued Common Stock - $.50 Par Value Shares Issued and Outstanding January 31, 2003 782 February 1, 2002 776 $391 $388 Capital in Excess of Par Value $2023 $1803 Retained Earnings $5887 $4482 Accumulated Other Comprehensive Income $1 $1 Total Shareholders’ Equity $8302 $6674 TotalLiabilities and Shareholder’s Equity $16109 $13736
What to Look For • Working Capital – do they have liquidity to build their business? = Current Assets – Current Liabilities • Current Ratio (Also Working Capital Ratio) = Current Assets/Current Liabilities • Acid Test – excluded inventory and therefore focuses on short-term obligations • Inventory Turnover = COGS/Average Inventory at Cost • If it’s increasing – it means the company is selling faster • Plant Turnover = Sales/(Property, Plant, and equipment) • Book Value – more important to value investors = Stated Value of the common stock + retained earnings + surplus reserves
What to Look For • Bond Ratio – 30-40%+ is bad • Preferred Stock Ratio • Common Stock Ratio • Leverage • Ratio of bonds to preferred stock • Long-Term Debt/Equity Ratio • Shows how much creditors own versus shareholders
Ratio’s and Analysis Examples • Working Capital FY02: $8302 FY01: $6674 • Current Ratio (Also Working Capital Ratio) FY02: 2.1 FY01: 1.9 • Book Value FY02: 6278 FY01: 4870 • LT Debt/Equity Ratio • FY02: .45 FY01: .56