Download
1 / 23
230 likes | 357 Views
Small Scale Wind Energy. Capacity factor. The net capacity factor of a power plant is the ratio of the actual output of a power plant over a period of time and its output if it had operated at full nameplate capacity the entire time.

E N D
Capacity factor • The net capacity factor of a power plant is the ratio of the actual output of a power plant over a period of time and its output if it had operated at full nameplate capacity the entire time. • To calculate the capacity factor, total energy the plant produced during a period of time and divide by the energy the plant would have produced at full capacity. • Capacity factors vary greatly depending on the type of fuel that is used and the design of the plant. The capacity factor should not be confused with the availability factor or with efficiency
Typical Capacity Factors • Wind farms 20-40%. [5][6] • Photovoltaic solar in Massachusetts 12-15%.[5] • Photovoltaic solar in Arizona 19%[7] • Thermal solar power tower 73%[8] (Solar Tres project, currently being built in Spain with a thermal storage capacity of ca. 15 equivalent full load hours). • Thermal solar parabolic trough (without thermal storage) ca. 15%[9] • Nuclear 60% to over 100%, U.S. average 92%.[5] Worldwide average varied between about 81% to 87% between 1995 and 2005.[10] • Base load coal plant 70-90%[5] • Combined cycle gas plant, about 60%[5] • Geothermal plant, worldwide average 73%, demonstrated 90%[11] • Hydroelectricity, worldwide average 44%
Net Metering • Net metering is an electricity policy for consumers who own (generally small) renewable energy facilities, such as wind, solar power or home fuel cells. • "Net", in this context, is used in the sense of meaning "what remains after deductions" — in this case, the deduction of any energy outflows from metered energy inflows.
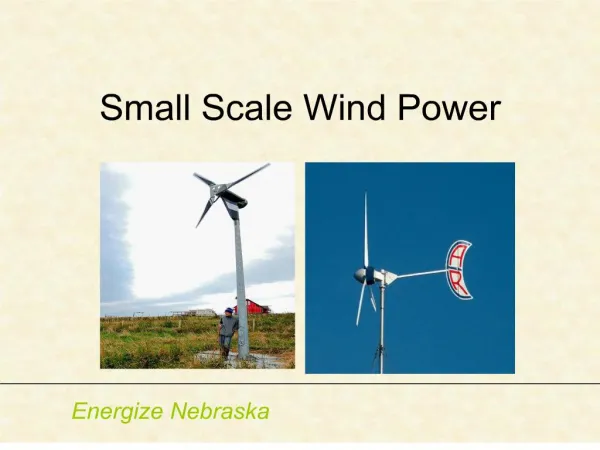
US Small Wind Market • The US market for small wind turbines – those with capacities of 100 kW and under – grew 78% in 2008 with an additional 17.3 MW of installed capacity. • This growth is largely attributable to increased private equity investment that allowed manufacturing volumes to increase, particularly for the commercial segment of the market (systems 21-100kW). • The still-largest segment of the market, residential (1-10kW), was likewise driven by investment and manufacturing economies of scale, but also by rising residential electricity prices and a heightened public awareness of the technology and its attributes.
Small Wind Statistics • 80 MW of cumulative installed small-wind capacity in the US. • US manufacturers’ sales account for 1/2 the global market. • $160 million in outside investment was injected into 18 manufacturers worldwide over the past three years. • At least 219 companies worldwide manufacture small wind systems, 35% of which are based in the US. • Industry predicts a cumulative US capacity of 1,700 MW within five years.
The industry projects 30-fold growth within as little as five years, despite a global recession, for a cumulative US installed capacity of 1,700 MW by the end of 2013. • Much of this estimated growth will be spurred by the new eight-year 30% federal Investment Tax Credit passed by Congress in October 2008 and augmented in February 2009.
States • In general, states that offer consumer incentives at a level of $2 per Watt of capacity or greater attract the strongest share of the small-wind market. • Based on a survey of residential turbine providers, states with highest sales percentages in 2008 were CA, NV, AZ, OR, NY, MA, and OH. • New Jersey and Hawaii would have been added to this list, say industry members, were it not for their unusually cumbersome permitting processes which have severely restricted their markets.
How much does a wind system cost? • Small wind energy systems cost from $3,000 to $6,000 for every kilowatt of generating capacity, or about $40,000 for a system (installed) large enough to power most of a home. • This is much cheaper than solar systems, but the payback period can still be lengthy – as little as 6 but up to 30 years. That's why it's important to take advantage of rebates or tax credits available for small wind system installations. Well-sited small wind turbines can usually pay for themselves within 15 years, about half their serviceable lifetimes, if the right incentives are applied.
Renewables Portfolio Standard • New Jersey's renewable portfolio standard (RPS) -- one of the most aggressive in the United States -- requires each supplier/provider serving retail customers in the state to include in the electricity it sells 22.5% qualifying renewables by 2021. The New Jersey Board of Public Utilities (BPU) made extensive revisions to the RPS in April 2006, significantly increasing the required percentages of "Class I" and "Class II" renewable energy, as well as the required separate percentage of solar electricity. By reporting year 2021, 2.12% solar electricity is required.
Renewables Portfolio Standard • "Class I" renewable energy is defined as electricity derived from solar energy, wind energy, wave or tidal action, geothermal energy, landfill gas, anaerobic digestion, fuel cells using renewable fuels, and -- with written permission of the New Jersey Department of Environmental Protection (DEP) -- certain other forms of sustainable biomass. • "Class II" renewable energy is defined as electricity generated by hydropower facilities no greater than 30 megawatts (MW), and resource-recovery facilities approved by the DEP and located in New Jersey. • Electricity generated by a resource-recovery facility outside New Jersey qualifies as "Class II" renewable energy if the facility is located in a state with retail electric competition and the facility is approved by the DEP.
The required percentages of each category and the total renewables percentage required are listed below, by reporting year: 6/1/04 - 5/31/05: Solar – 0.0100%; Class I – 0.740%; Class II – 2.5%; Total – 3.2500% 6/1/05 - 5/31/06: Solar -- 0.0170%; Class I – 0.983%; Class II – 2.5%; Total – 3.5% 6/1/06 - 5/31/07: Solar – 0.0393%; Class I – 2.037%; Class II – 2.5%; Total – 4.5763% 6/1/07 - 5/31/08: Solar – 0.0817%; Class I – 2.924%; Class II – 2.5%; Total – 5.5057% 6/1/08 - 5/31/09: Solar – 0.1600%; Class I – 3.840%; Class II – 2.5%; Total – 6.500% 6/1/09 - 5/31/10: Solar – 0.2210%; Class I – 4.685%; Class II – 2.5%; Total – 7.406% 6/1/10 - 5/31/11: Solar – 0.3050%; Class I – 5.492%; Class II – 2.5%; Total – 8.297% 6/1/11 - 5/31/12: Solar – 0.3940%; Class I – 6.320%; Class II – 2.5%; Total – 9.214% 6/1/12 - 5/31/13: Solar – 0.4970%; Class I – 7.143%; Class II – 2.5%; Total – 10.14% 6/1/13 - 5/31/14: Solar – 0.6210%; Class I – 7.977%; Class II – 2.5%; Total – 11.098% 6/1/14 - 5/31/15: Solar – 0.7650%; Class I – 8.807%; Class II – 2.5%; Total – 12.072% 6/1/15 - 5/31/16: Solar – 0.9280%; Class I – 9.649%; Class II – 2.5%; Total – 13.077% 6/1/16 - 5/31/17: Solar – 1.1180%; Class I – 10.485%; Class II – 2.5%; Total – 14.103% 6/1/17 - 5/31/18: Solar – 1.3330%; Class I – 12.325%; Class II – 2.5%; Total – 16.158% 6/1/18 - 5/31/19: Solar – 1.5720%; Class I – 14.175%; Class II – 2.5%; Total – 18.247% 6/1/19 - 5/31/20: Solar – 1.8360%; Class I – 16.029%; Class II – 2.5%; Total – 20.365% 6/1/20 - 5/31/21: Solar – 2.1200%; Class I – 17.880%; Class II – 2.5%; Total – 22.5% Renewables Portfolio Standard